ROTOR 2INpower In-Depth Review

Over the last few years, ROTOR has been slowly increasing both the quantity of power meters they make – as well as the types of power meters they make. It first started with the original ROTOR Power LT some three years back, and then two years ago they introduced the left-only variant, INpower. However, last spring they announced the dual left/right variant- 2INPower, which they started shipping this past fall. That dual left/right leg variant that includes both ANT+ & Bluetooth Smart is what I’m covering in this review.
I’ve been riding a ROTOR 2INpower lately, covering a wide assortment of conditions. A number of indoor and outdoor rides across all sorts of lovely winter-ish (and now spring-like) conditions. In doing so, I’ve been recording boatloads of test data, with usually 2-3 other power meters on the bike at the same time. Like normal, I’ll be sending the unit back to ROTOR once I’ve wrapped up the review.
With that – let’s dig into what’s in the box and then get it setup on the bike.
Unboxing:

When it comes to power meter unboxing’s, there’s no bigger box than the ROTOR 2INpower kit. It’s like one of those egg-drop tests you did as a kid where you design the packaging to protect the egg being dropped from the top of a fire truck ladder.

Now in my case, I got a small pile of different things in the mail outside of this box. This included an extra bottom bracket adapter and an installation tool:

Plus, I’ve got extra chainrings that we’ll talk about in a second. So for the moment, let’s just focus on the core components of the power meter box:

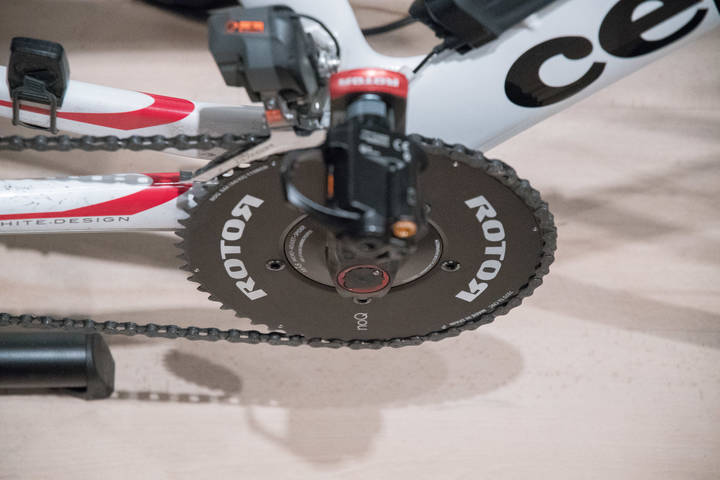
Above, you can see the left and right crank, the spider (attached to drive-side right crank), some paper manual stuff, and a small box of parts.
Here’s a closer look at the two crank arms…which really do look stunning in that color design.

Oh, and don’t even think about removing that bolt. If you do ROTOR will reach out and kick you in the nuts…which is fair since that’ll be less painful than the crank arm falling off while riding.

As for that little box, here it is with its top off:

Inside you’ll find the USB charging cable, two spacers for installation, and bolts to attach your chainrings to the spider.

Now as I noted earlier, your exact box will vary a bit based on which chainrings you select. In this case, you’ll need both an inner and outer chainring. For my testing, ROTOR sent me over both a set of q-rings (non-round, oval rings), as well as regular round rings. I focused on round rings, since it allows me to more accurately compare power between varying power meters.
Though, the support of q-rings is a key benefit of ROTOR’s power meter platform over many rivals such as Quarq and SRM which don’t support non-round chainrings.


With that, you’ve got all the parts accounted for. Thus, it’s time to get installation completed.
Installation/Configuration:

As usual with crank region power meters, your installation will vary based on what you had on your bike previously. In my case, for example, I needed to swap out the previous bottom bracket for one compatible with the new power meter. No big deal, but if you don’t have the right tools to do so, you’re pretty much hosed. So just keep that in mind (or, chat with your friendly local bike shop and have them take care of it for you).
First up in my case was removing that older bottom bracket:

Next, I got all the parts laid out on the floor. There was quite frankly a crapton of parts in this box. Not in a bad way, but just in a quantitative way.

Soon I had the new bottom bracket in:

Then it was off to put the chainrings on the crank arms. If you’ve never done this before, it likely looks harder than it is. But really, it’s just going ‘round and ‘round with a hex wrench and five bolts to get them tight.

Next comes consultation with the manual on using the funky-ish bolt system of the ROTOR cranks. Again, not hard, but if like me you don’t install ROTOR cranks every day, then you’ll want to ensure you know which order to tighten which bolts.

Then it’s onto the bike frame you go…both left and right side:


Then as always, grab that torque wrench to validate everything is up to spec. Don’t want anything to fall off now…do ya?

Finally, toss on your pedals and call it macaroni:

With that – you’re done. Technically you’ll also do a zero offset/calibration, but I’ll cover that in the general use section below. It’s the exact same no matter when and where you do it.
Also, as a general rule of thumb with power meters, I’d recommend doing a few quick sprints (5-10 seconds, 3-4 times) on a trainer to tighten everything up. Then zero offset again just for fun.
General Use Overview:

Like most power meters these days, the ROTOR 2INpower is pretty easy to use, and pretty straightforward. To begin, we’ll talk about charging, since without it – you’re up a creek without a paddle (or, a crank as it may be). The unit contains a rechargeable battery, which ROTOR states has a battery life of 250 hours. Power meters using rechargeable batteries isn’t a new thing these days, and in fact, a number of newer companies are doing so (SRM even considered it for a while as well). You’ll find the charging connector directly where the axle pops out of the crank arm:

It charges using a little magnetic connector that you can plug in the other side to any USB port you can find (well, except USB-C):

While charging, the unit will slowly pulse the light, which is somewhat soothing. You know, in the event you sleep next to your bike at night.
Next, we’ve got calibration. The unit supports a manual zero offset, which helps to ensure all is right in the world. ROTOR says to do it every once in a while, including where large temperature shifts may have occurred. This is pretty much standard for most power meters out there. To complete a zero offset, you’ll place the left crank arm in a 6’oclock position (downwards), and then press to calibrate on your head unit:
You’ll receive a confirmation back of 1000 on the head unit. After which you’ll then rotate the crank arms two full rotations, and press calibrate again, which should give you a new number that’s +/- 200. In my case, it floated between 72 and 77.
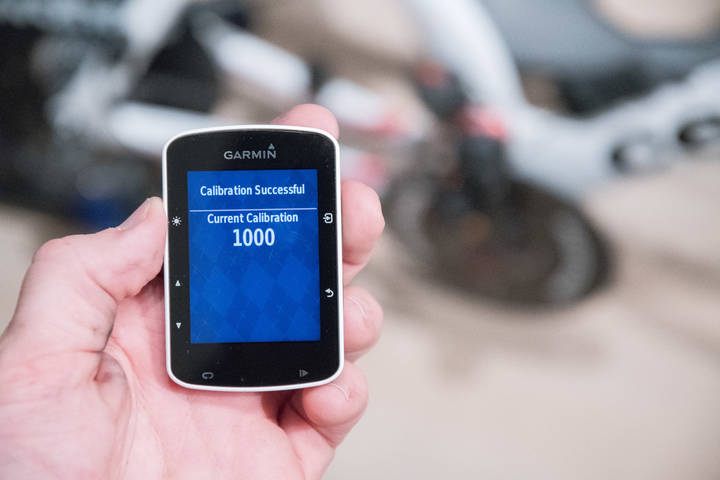
It should give you a successful message, and you’re looking for the values to be consistent each time you do them. This appears to be a bit different than how other power meters work in that they tend to give you details on what might have shifted. Whereas the ROTOR instead seems to give me the same numbers every time.
Note that you can also complete this task via the smartphone app as well, but more on that later.
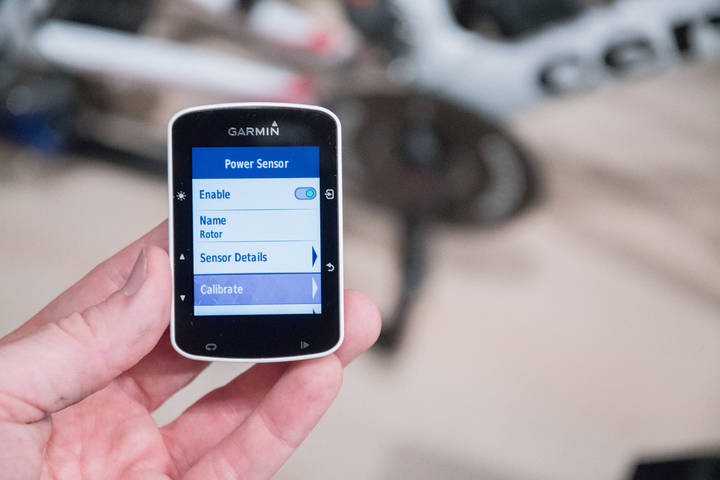
When it comes to pairing the ROTOR 2INpower to a head unit, you’ve got two options: ANT+ or Bluetooth Smart. Both options being the two main ways power meters communicate to bike computers. For example, if pairing to a Garmin head unit like the Edge 520, you’ll see the ANT+ ID listed when you search for a power meter:

You can then pair to it and customize the name as you see fit:
You can/should also set the crank length in the settings as well. In my case, I use 175mm cranks, so it’s different from the 172.5mm default. The difference for round-rings would be about 1-2%, somewhat based on cadence, between those two values. So it’s worth getting right.
When it comes to data recorded by the head unit, it’ll vary by protocol. Here’s what you’ll get for each one:
ANT+ Power (total)
ANT+ Power Balance
ANT+ Cadence
ANT+ Torque Effectiveness
ANT+ Pedal Smoothness
Bluetooth Smart Power
Bluetooth Smart Power Balance
Bluetooth Smart Cadence(Note: You’ll get additional metrics through the ROTOR app, which I cover in the next section.)
Here’s an example of a ride file recorded on a Garmin Edge 520, that shows what data you get when paired to the ROTOR 2INpower. You can also look directly at the linked file here on Garmin Connect.

Finally, I normally include in this section details about the app – but since ROTOR’s app is a bit more detailed than most other power meter apps, I’ve decided to let it grow up and get its own section.
ROTOR App Overview:

ROTOR has long had a more detailed power meter app story than most other companies. One of the key benefits that ROTOR likes to demonstrate at shows and bike events is how the unit can display your pedaling force in a graphical manner in real time. With 2INpower, the easiest way to do that is to use their free app, aptly called ROTOR POWER, which can be downloaded for iOS or Android. In my case, I used it as both an iPhone and iPad app.
For the iPhone side of things, it’s useful for quickly checking firmware or settings. As well as doing a calibration in the odd event that your app of choice can’t send a calibration command to it. You’ll start by searching for the sensor (or, a heart rate sensor).


As seen above you can calibrate the unit or pull up basic product ID and battery settings. It’s all somewhat basic.
Where things get more detailed is within the recording and analytic side of the app. For that, I’ve switched over to the iPad, as it’s easier to use while on a trainer. You’ll start off on the main screen, which shows you the different components of the app:

Ride, Basic Training, and Torque 360 are all the analytic side of the program. Service is basically what you saw above with respect to checking settings and information. And history just shows you files from the previous three analytic sides…except without being able to export or do anything useful with them.
Looking at the ‘Ride’ side first, you’ll get data shown and recorded from the power meter. If using GPS outside (such as on a smartphone), you’d also get speed/distance/ascent data. All the metrics you see to the left are near identical to what you’d get on a head unit. Whereas on the right-hand side the OCA (Optimal Chainring Angle)/OCP data is unique to the ROTOR program.

To dive into the OCA/OCP pieces, let’s switch to the ‘Torque 360’ app, which shows what’s going on in more detail. Within this, you can see my pedal stroke analysis on the right side. In the below screenshot I’m pedaling with both legs, and thus things are pretty normal in terms of balance as well (48%/52%).

But now watch as I do a left-only and right-only leg pedaling, below separately. You’ll see not only does the balance shift, but so does the torque plot.


More importantly in the above images is that the balance goes to 100/0 and 0/100. That means it’s correctly zeroing out the leg not pedaling. Some power meters might show 98/2 and 2/98 or similar. So it’s good to see it cleanly 100/0 or vice versa.
At the end of doing your analysis/ride you can view a summary, which in turn also saves the data to your device for later retrieval.


Finally, within the ‘Basic Training’ option, you get metrics similar to the above, except with some pretty timeline graphs, plus you get the ability to see torque displayed in bars.

Once completed with your rides, the app will save the files into a folder on your smartphone with a .FIT and .CSV file. Unfortunately for iOS users this means having to plug your device into a physical computer to get the files off, as there isn’t a simple e-mail/send option. For Android users it’s the same, but at least you don’t have to use iTunes on the computer.
Given this is really just the first version, hopefully we’ll see ROTOR add those features soon.
Power Meter Accuracy Results:

I’ve long said that if your power meter isn’t accurate, then there’s no point in spending money on one. Strava can give you estimated power that’s ‘close enough’ for free, so if you’re gonna spend money on something it shouldn’t be a random number generator. Yet there are certain scenarios/products where a power meter may be less accurate than others, or perhaps it’s got known edge cases that don’t work. Neither product type is bad – but you just need to know what those use/edge cases are and whether it fits your budget or requirements.
As always I set out to find that out. In power meters today one of the biggest challenges is outdoor conditions. Generally speaking, indoor conditions are pretty easy to handle, but I still start there nonetheless. It allows me to dig into areas like low and high cadence, as well as just how clean numbers are at steady-state power outputs. Whereas outdoors allows me to look into water ingest concerns, temperature and humidity variations, and the all important road surface aspects (i.e. vibrations).
In my testing, I generally use between 2-4 other power meters on the bike at once. I find this is the best way to validate power meters in real-world conditions. In the case of most of these tests I was using the following other units:
Kurt Kinetic Rock & Roll Smart Control Trainer
PowerTap G3 hub based power meter
PowerTap P1 pedals based power meter
Tacx NEO Smart Trainer
(+ Data analyzed on an Elite Drivo & CycleOps Hammer that’s not mine)
With a configuration like the ROTOR 2INpower, I’m somewhat limited on placing other crank/crank-arm based power meters on there. So I have to compare with other pedal units and hub based units, both of which I primarily prefer PowerTap’s options due to ease of transfer.
In general, my use of other products is most often tied to other things I’m testing. Also, when it comes to data collection, I use a blend of the NPE WASP data collection devices, and a fleet of Garmin head units (mostly Edge 520/820/1000 units).
Note all of the data can be found in the links next to each review. Also, at the end is a short table with the data used in this review. I’ll likely add in other data not in this review as well once I finish consolidating that data. I’m a bit behind on getting data off some of my head units into folders.
With that, let’s get right into it and start with analyzing an indoor trainer test, the ‘dreaded’ 30×30’s. I often use this in both trainer and power meter reviews as a way to evaluate how quickly a given unit responds to vast changes in power.

I’ve created a custom TrainerRoad workout that quickly tests this in a matter of 12 minutes. As always, here’s the uploaded file set from this workout in the DCR Analyzer, which you can download the original files or use the online analyzer to take a look.
Side note: You can actually try out this same test workout yourself. To do so simply join the DCR TrainerRoad ‘Team’, which is the way you can share custom workouts with others. You’ll see said workout in there and can then give it a whirl yourself.
In any event, here’s how that looks:

As you can see, all three units track the change in power virtually instantly, which is a shift from ~140w to ~400w, held for 30 seconds before recovering and repeating 8 times. However, what you see is a bit more separation than I would like between them. Specifically, the ROTOR 2INpower is reading a bit higher than I’d expect. You can see that when I zoom in, where the difference seems to be about 15w higher than the others.

Now normally you’d see drivetrain losses between the crank and the rear cassette (i.e. the Tacx NEO and crank/pedals), but that wouldn’t account for the losses seen between the P1 and the 2INpower. And then from a purely technical level, the 2INpower should be ‘below’ the PowerTap P1, with the P1 reading the highest (since it’s closest to the foot/leg). Now in most cases, you’d see almost no difference between a crank and pedal based power meter, maybe a watt or so. So this is more than I’d like to see, at about 3.8% high (assuming 15w on 400w). That’s just barely technically within the boundaries of +/- 2% on both the ROTOR and PowerTap units, so technically it’s OK, but I’d prefer to see it closer. And to be fair, I’ve seen similar separations between the P1 and Quarq DZero as well as PowerTap C1 power meters in other trainer tests, so it’s not unheard of.
For the most part, the separation stays constant throughout that test, though at the end we see the Tacx unit drop substantially from the rest during a quick one-leg test. Not sure why, that’s odd.
Next, before heading outdoors, let’s look at another indoor test – this one on Zwift. This was relatively short – about 25 minutes, but shows more stable riding, with one sprint tossed in for good measure.

We see a similar pattern here of it generally reading high by about 8-10w on 210w, and more at higher levels. You may be wondering why the units may appear evenly spaced, but I’m not giving the P1’s vs Tacx Neo as much of a hard time? Well, simply put, the difference is explainable. Drive train losses plus accuracy ranges easily account for that 11-12w difference. They don’t account for a 20-22w difference between the ROTOR and NEO, nor the 8-10w difference between P1 and ROTOR. But again, there have been cases of similar tests I’ve done in the past where we see this sort of splitting on the Quarq and C1 units, among other power meters.
Here’s another Zwift workout as well. Again, the ROTOR reads slightly higher than the other this time as well – in the same ballpark as the previous two workouts (though slightly more in some cases). Interestingly the P1 gets close to matching the NEO in most places here.

At this point, I’m a bit perplexed. Quite frankly, with the exception of the LIMITS power meter, it’s incredibly rare for power meters these days to have oddities on indoor trainers. It’s kinda the easiest bar to pass. So I started chatting with Shane Miller, who is also working on a review of the ROTOR 2INpower. And perhaps, more importantly, he’s got just about as much gear to cross-reference power meters as I do. Plus, he’s technical enough to trust that he’s ‘doing it right’, when it comes to calibration/etc…
And sure enough – he’s seeing the exact same things I am:
– Indoor rides with the Tacx Neo, PowerTap P1, and ROTOR 2INpower: All of which have the 2INpower slightly higher than expected.
– Indoor rides with the CycleOps Hammer, PowerTap P1, and ROTOR 2INPower: Again, 2INpower slightly higher than expected.
So that left us both thinking (and slight spoiler alert here) – why is it that outside seems mostly fine, but indoors is? Is there perhaps some sort of odd bike motion at play? Well, Shane’s idea was to break out the Kinetic Rock & Roll trainer, which the company happened to send me one to try out this winter. So I got that all updated and gave it a whirl. This enabled me to keep the PowerTap G3 wheel on, since it wasn’t a direct drive trainer (wheel-on trainer instead). Results below:

Ignore the fact that the Smart Control drifts like an iceberg and has useless power data. But the PowerTap P1 and PowerTap G3 data, along with the ROTOR data was good. In fact, if we ignored the Kinetic data, you’ll see that ROTOR performed much better in this bike swaying setup than not. Though, it still read slightly high – but at least within reason – a mere 2.8% difference across most of the ride.

At this point, I’m putting this in the unexplainable camp of ‘it doesn’t like static trainers that much’. I don’t have a magical pony answer though as to why. The data is what it is. So, I took the data back to ROTOR, and let them poke at it some. In their opinion, we see a bit more divergence between the pedal based and crank based power meters indoors across many sets of data I’ve provided (beyond just this review). Meaning that they’re saying that the differences are no different than past reviews.
And in some of the workouts above, that’s definitely true (as I noted earlier). Yet in others, like the 1st 30×30 test, that’s not true. It’s just a lot higher.
Now, just to add more fuel to the WTF mix, Shane doubled down again this morning – with more data. This time on the Elite Drivo trainer. In that test he saw similar results to my Kinetic test done late last night – the power meters were happy. His Elite Drivo near perfectly matched the ROTOR 2INpower for the majority of the ride.

There were a few cases where on the shorter sprints the 2INpower overshoots slightly, but it’s pretty minor and goes back to my existing statements on trying to quantify 1-second power for max sprints.
With the indoor tests showing the ROTOR either good or slightly high, let’s head outdoors. That enables us to swap the Tacx NEO for the PowerTap G3 hub, although that’s equally as trusty. The file below is from a roughly 2-hour ride out to the countryside and back. It contains lots of stop and go at the start, some pretty rough roads along the way (cobblestones), and more on the return. It’s a good mix of terrain to test with.

So in general, the three units are actually pretty close throughout much of the ride, usually within 10w or so between 200w and 300w. Thus in many ways, this is much better than the indoor rides.
For example, in this section here, we see some slight jockeying for position during the increase of power, but the largest gap I can find between units is around ~15w at ~325w (or 4.6%, at the edge of the margin of error once drivetrain efficiency is accounted for). However many other sections are only a watt or two difference, like where the mouse is placed below:

If I look at the various sprints, we see the units align pretty closely – though having differences as to what the max power is. For example, starting with a 10-second smoothing, I see quite a spread:

But if I go down to 0-seconds of smoothing, I get pretty darn close (about a max 20w difference on 745w between the units – or a mere 2.6%, well within the margin of error of two units each at +/-2% + drivetrain losses). But you can see why I don’t like comparing 1-second maxes below – it comes down to a story of transmission and recording rates, rather than true maxes.

For this ride, it’s better to look at the mean/max graph, which overlays how these units compare across a number of power-time durations:

Here you can see things generally look quite good. The PowerTap P1 does spike higher than the other two for max 1-second power, but it’s unclear at this point which unit is correct there. For everything under that, they’re all within a 1-2% of each other. Note that the above was a standing sprint.
Let’s look at one last outdoor ride, this one about three hours long on varied terrain including city and country roads.

In general, things are pretty good on this ride. The majority of the time the three units track very closely, usually within 10w at 300w+.

I get slight differences in sprints between the units. Sometimes the P1 is slightly higher, sometimes the ROTOR is slightly higher. Never is the PowerTap G3 hub slightly higher. Although within a few percent.


And in some cases, I get really perfect alignment, like this sprint here – all units within 3w at 717w.

If I look at cadence on this ride, I see things are pretty consistent between the units. Some very slight differences on stops/starts, which is normal due to how different units track going from pedaling to zero (or vice versa). But otherwise very consistent.

So where does that leave us? Well honestly, a little bit conflicted.
Indoors I’m putting the ROTOR somewhere between either ‘Good’ or ‘A tiny bit high’, but if it’s high, it’s at most 1-2% higher than it should be, whereas again, in some cases it’s fine. Note that every single ride/test/workout has a calibration (zero offset) done prior to the ride, and in many cases about 10 minutes in. In all cases, the bike has been in that temperature situation for at least 10-15 minutes prior to the start of the ride.
Outdoors I see actually better results, which is kinda funny – as that’s rarely the case. For the most part, the unit tracks well. I saw a few sprints (not many), where the ROTOR seems to slightly undercut the power on sprints, though just barely. As far as cadence goes, I’m just not seeing anything of concern there across any of the files. So all is good on that front.
It’s the indoors being over that I can’t really get my head around. Maybe I’m nitpicking the data too much (though, without putting words into Shane’s mouth – I think he agrees it’s a bit high). Or maybe I could nitpick other data sets previously more. I’m not sure. Or maybe there’s something else I’m missing. I’ll let you decide.
Speaking of files, here are all the raw files from these activities (plus more I didn’t show above). You can go into the DCR Analyzer and poke around at the various graphs (zoom in/etc…), as well as download the original .FIT files from each workout.
ROTOR 2INpower Data Sets
May 9thAnalyzeROTOR 2INPower, PowerTap P1 Pedals, PowerTap G3 Hub, Kinetic Rock & Roll Smart Control, TrainerRoadMay 8thAnalyzeROTOR 2INPower, PowerTap P1 Pedals, Tacx NEO, Zwift iOSApr 11thAnalyzeROTOR 2INPower, PowerTap P1 Pedals, Tacx NEO, TrainerRoad iOSApr 9thAnalyzeROTOR 2INPower, PowerTap P1 Pedals, PowerTap G3 HubAPR 7thAnalyzeROTOR 2INPower, PowerTap P1 Pedals, Tacx NEO, Zwift iOSAPR 6thAnalyzeROTOR 2INPower, PowerTap P1 Pedals, PowerTap G3 HubAPR 2ndAnalyzeROTOR 2INPower, PowerTap P1 Pedals, PowerTap G3 Hub
Power Meter Recommendations:
With so many power meters on the market, your choices have expanded greatly in the last few years. So great in fact that I’ve written up an entire post dedicated to power meter selection: The Annual Power Meters Guide.
The above-noted guide covers every model of power meter on the market (and upcoming) and gives you recommendations for whether a given unit is appropriate for you. There is no ‘best’ power meter. There’s simply the most appropriate power meter for your situation. If you have only one type of bike I’d recommend one power meter versus another. Or if you have different needs for swapping bikes I’d recommend one unit versus another. Or if you have a specific budget or crankset compatibility, it’d influence the answers.
Now since the guide came out this past fall, there really hasn’t been any major entrants in the market that weren’t already covered in that post. However, there have been two noteworthy new entrants, plus Quarq that was previously announced/discussed:
A) 4iiii Precision Dual Review: The post in my annual power meter guide didn’t cover the accuracy aspects of the newer left/right setup, so I didn’t dive into general recommendations. But as you saw in my in-depth review a few months ago, that’s solid. No issues recommending it, works well.
B) WatTeam Gen2 Dual: You also saw this review a couple months or so ago, and it was mostly pretty good. The WatTeam re-introduced their $499USD dual left/right power meter this past winter. There were two quirks that I saw though, so you’ll want to check out that review to see if those impact you.
C) Quarq DZero: I discussed this and included it within the post, but just in case you didn’t see my in-depth review, that’s located here.
But again – check out the power meter recommendations guide here. I typically do this in September. And while there were some new models announced at Sea Otter a few weeks ago, there wasn’t really enough to move the needle on re-doing a full recommendations guide right now. Thus short of anything unexpected happening, I’ll likely hold off on doing another annual summary until September as well. Especially since the word ‘annual’ implies once a year. ?
Summary:

Phew – you made it to the end! So where do we stand? Well, ROTOR brings to the table a unique offering in the 2INpower that’s a bit different than other power meters on the market. Sure it does total power and left/right balance, and all that jazz, but it also is one of the few power meters to support elliptical chainrings (non-round rings). It’s also one of the few power meters to support not just displaying, but actually recording all of the extra force metrics seen in their app (including GPS data). And finally, it’s one of the few power meters using a rechargeable battery, which some folks prefer.
On the accuracy front, things were solid outdoors, with no issues through any number of situations – including rough terrain/cobbles. Indoors, I believe I’m still seeing (very) slight highness in some cases (but not all). ROTOR would argue that it’s no different than I’ve seen before in other reviews, and I agree with them in some data sets (but not all). As I noted earlier, perhaps I’m nitpicking it too much. And one thing that I often talk about is that there’s the reality of power meters simply producing slight differences that I can’t explain – no matter the brand or model.
And that’s something that often gets overlooked. Being one of the few people on earth that for years has been riding 3-4 different power meters on every single ride and recording all that data, I see some unexplainable stuff over time. Usually nothing big, just minor quirks. A percent here, a percent there – rarely with any reason. Ordering might be different one day versus another. Sometimes I nitpick it more than others. But that’s the reality of power meters today – for all brands (and I’ve ridden or own them all). Can I train by the 2INpower? Absolutely. Is it better than left-only power meters? Definitely.
With that – thanks for reading! Feel free to drop any questions below – I’d be happy to try and get them answered.
(Oh, and definitely checkout and subscribe to Shane’s (GPLama) YouTube channel for cycling and sports tech geek goodness, he’s the best out there. I appreciate all the data and thoughts he’s contributed here as well.)