WatTeam PowerBeat Gen2 Power Meter In-Depth Review

It’s been a few years since WatTeam first jumped onto the power meter scene. Back in the summer of 2014 they boldly exclaimed their plans to ship a dual left/right power meter solution for $499 – breaking what is largely considered a pretty magical price point for power meters (especially at that time). As I’ll cover in the next section, it’s been a long (and bumpy) road for the company to get to this post, but over the last month they’ve started shipping their 2nd generation PowerBeat product.
Their ability to get to this price point is due to WatTeam’s ‘shifting’ of the manufacturing from an expensive factory to your living room. While other companies like Stages and 4iiii are gluing sensors to crank arms for you, WatTeam believes that you can do it yourself. And more importantly, that you can do it in a repeatable and accurate way. And that’s ultimately what this review is about: Does this method actually work?
Back in December the company flew to me, where we spent time installing it on not one, but two crank arm sets. I did the installation following the app on my bike, just like you would if the box arrived on your doorstep. They watched over and took notes on my responses and reactions.
I’ve been riding the PowerBeats since then, putting it through its paces both inside and outside. Acceptable weather and not so awesome weather. Smooth roads and nasty cobblestone roads. The goal being to find out what, if any, cracks there are in the self-install system. Once I’m done with that I’ll use their remover glue to remove the pods and send the whole kit back to them like I usually do.
So, let’s dive into it.
The Past (and Future) of WatTeam:

Like last week’s 4iiii Precision power meter review, it’s important to take a brief step back and talk about how we got here, even more so for WatTeam. After all, this isn’t their first power meter launch rodeo. For better or worse, it’s actually their second attempt at the PowerBeat product, with the first attempt last winter being recalled after inaccurate readings. But to their credit, they did the ‘right thing’ for their customers, and were upfront and honest about the issues – a trait that not all power meter companies in the industry share.
They’re back almost precisely one year later, both far more humble, and with what is quite frankly a better product. While from a bike-length away it may look like the same product, there are many nuances both internally and even during installation that differ significantly. These tweaks having the goal of ensuring not only accurate data, but also a cleaner installation process.
Of course, this review will cover whether those changes over the last year have made a difference.
But what about going forward? Sure, I might normally cover this at the end of a post, but there are some planned items that are worthwhile mentioning now. First is the company is planning on shipping a mountain bike variety soon, which is essentially a small casing that protects the pods. You can see how this appears here:


Of course – road riders can also use this if they’d like, though I haven’t seen it be a necessity at this point. Perhaps for something like CX it might make more sense however.
Next, in a post back at Interbike a few months ago, I showed their longer term vision for other crankset companies to be able to leverage their technology into a much more compact form factor onto the edge of the crank arm. You can see an example of this here:
Obviously, by shifting the production facility back away from your living room to a dedicated location, they’re able to do things to crank arms that you can’t (or at least, wouldn’t want to). Still, I suspect this part of the future is quite far away. I’ve often talked to many start-ups in the power meter world that want to appeal to the major OEM’s, but those talks rarely (almost never) result in any fruit. The negotiations and flirtations last for years, and even then often fall apart.
Still, it’s great to see they’re thinking ahead (and really, more to a different/secondary market). Any tech company that wants to be successful at anything needs to have one foot in today’s world, and one foot in tomorrow’s. But, let’s focus on what they’ve just released now.
What’s in the box:


While many crank-focused power meters come installed on your crank-arm or similar, PowerBeat doesn’t. Rather, that’s your job. Instead, it comes in a box with all of the parts relatively clearly labeled.

Once you’ve taken all those out, here’s what the situation looks like:

Let me help to demystify what some of these parts are. It’s not as complex as it looks:
Pencil: It’s a pencil. Duh. Used for marking your crank with install spot.
Two plastic ruler looking things: Used to align installation spot, combined with pencil, it’s magic.
Giant plastic bags: You fill these with water, which acts as a weight.
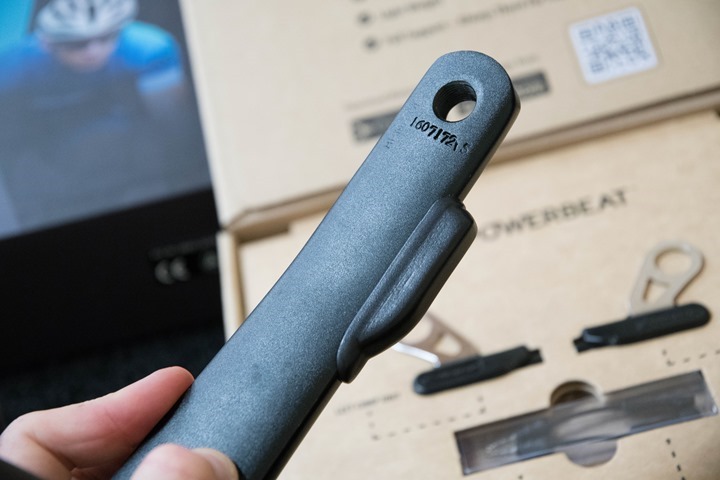
Two comp pods: These have the batteries and communications chipsets in them
Two sensors: These are the strain gauges that attach to your crank arms
Charger: These charge your Comp Pods, and connects via USB
Washers (in plastic bag): Simple washers, for spacing on crank arm
Plastic gloves (in plastic bag): Also just simple plastic bags to keep your hands clean from glue
Glue (in plastic bag): Glue that you mix together, like most epoxies
Mixing stick (in plastic bag): A small stick to mix said glue
Sandpaper (in plastic bag): For creating a very faint abrasion on the crank arm (it’s very fine sandpaper)
One snack size package of Oreos: Just seeing if you’re paying attention.
Hooks & Cable Stickers (in plastic bag): For holding water bags during weighing, and for keeping cables clean
Rubber bands: Used during installation/gluing. Afterwards can be used for rubber band fight.
Ok, I suppose that looks like a lot. But it’s really more of me being pedantic with all the parts. I think the biggest challenges that WatTeam has is reducing what looks complex, but really isn’t. Speaking of which, let’s move onto installation.
Installation/Configuration:

As I was just saying – WatTeam’s biggest challenge is installation. Not the actual installation, but the perception of it. I can guarantee you that some will scroll to this section, see the pictures, and then close this browser tab. They’ll be the same people that then go onto various internet forums and proclaim how messy/difficult it is to install, even though they’ve never installed it.
Except, they’d be wrong.
It’s actually far simpler than you’d expect to install. Yes, it takes some time. But not a lot. You could budget 45 minutes and easily be done with the active work portions in that time. That’s certainly less time than it’d take for you to drive to a bike shop, wait for them to install a new power meter of another brand, and drive home. It’s not complex, nor is it difficult. It does, however, require you to be able to follow instructions. It’s no different than following a recipe from a cookbook. If you can bake cookies, you can do this.
The entire process is guided by their mobile app, which has simple installation/instructional videos within it. Each section will show you how to do that step, and then wait for you to follow it. It’s like ‘Simon says’.
The first step is using the phone app to scan the barcode on the box. This allows the app to lookup the exact pod ID’s and create a pairing.

Then from there we’ll take out the little plastic ruler pieces. These are simply used to mark where to install the sensor. Put your pedal through it, and then grab that pencil to mark the spot. Done.

Next, you’ll wet the sand paper, and then very lightly rub/sand in the spot where the sensors are going. You can see in the below photo that it’s very faint (the abrasion) – barely noticeable even when pointing a camera right at it.


Then you’ll go ahead and take out the sensor and rubber bands, and validate the location and alignment. Like a test run. After which you’ll use some cleaning pads to clean off that spot. After which you’ll mix the glue together and apply it to the bottom of the sensor (first cleaning the sensor as well). Then you’ll press down on the sensor for a few seconds to ensure it’s snug.

(I don’t have great photos of me holding the sensor while gluing, since I needed two hands for this).
At which point you’ll repeat the process for the other crank arm, and then come back 24 hours after the glue hardens overnight.

It’s really that simple.
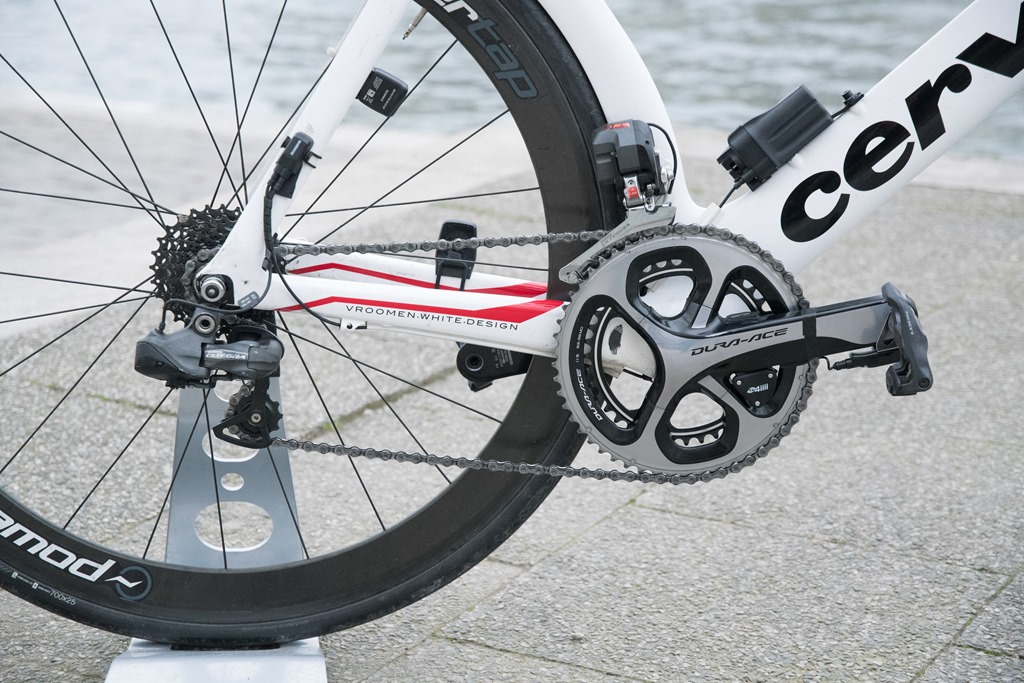
The last piece is installing the comp pods, which house the communications and battery pieces. But this is silly easy. Simply put a washer in place, and then spin the pedal into the hole on the metal holder of the pod. Not much different than how it works with Garmin Vector, Polar/Look KEO, or bePRO’s systems.

You’ll then connect the cable from the sensor pod to the comp pod, which provides battery power to the sensor.


The part that people get all bent out of shape on though is coming up – which is the water bag part. Remember those big plastic bags I showed earlier? Well, go and fill them to the top with water. Try and get them as close to the top as possible (extra water will simply push out, that’s fine).
These bags act as weights, which are used to calibrate the unit. It’s actually pretty ingenious, since it ensures an exact weight – versus someone trying to use dumbbells or something.

The app will guide you through the calibration process, which is done with your bike upside down. Essentially it rotates you through a bunch of positions, which allows them to accurately calibrate the device based on your specific crank arm properties. Somehow, I don’t have a picture of this – which is really too bad. I’ll need to do a re-enactment. In the meantime, here’s their video explaining how it works:

During this, the app will be providing real-time feedback and will reject any attempts that aren’t perfectly aligned. Further, behind the scenes, the company’s support division is receiving the metrics live, and can and will reach out to you if they see something amiss. They’re also available for video conference calls too (from which I hear good things from DCR Readers who have used them).
The only downside to the water bag dance is that getting the bags to hold tight in the right positions can be tricky depending on how exactly your pedals are designed. Some pedals are easier than others. For example, these Look KEO pedals that have a big hole in them for the hook to go through are super easy. Whereas the PowerTap P1 pedals are a bit trickier since they lack that hole, so you have to put the strap over it entirely. Not impossible, just requires a few seconds more patience.
Once you’ve completed the water bag dance, you’re done and ready to roll.
General Use Overview:

For the most part, once you’ve completed the installation, the unit acts much like most other power meters. We’ll start with charging though, since I recommend you do that first. A single charge is rated for 60 hours. To do so, you’ll un-pop the charging plug out of the pod:

(In case you’re wondering – the final production cable tie/stickers back in December hadn’t arrived yet, so it was black tape for me.)
Then you’ll simply plug in the USB charging portion.

The charging pod has nice super-long cables, so you can easily charge from quite some distance away.

The pods will show their current charging status – making it easy to know if they’re done. You can see the green light below. Once all set, go ahead and remove the charging cable and pop back in the sensor pieces.

At which point you’re ready to pair up your head unit. Within the app you’ve got the ability to toggle between ANT+ and Bluetooth Smart modes. At present, the unit doesn’t dual-broadcast ANT+ and Bluetooth Smart, though that’s something they’re considering enabling. For now, I largely used the ANT+ mode.


Note that on the Bluetooth Smart mode they’ve got a few variants to cover the variations in different head units in how they record power. Yes, it should be standard across the board…but alas, nobody wants to be.
As with most Garmin devices, I renamed the ANT+ ID (61775) to the name of the unit, to make it easy to track. Note that like all other power meters, you’ll simply scan for nearby units and it’ll easily find it. The above screenshots just are there for your documentation purposes.


You’ll have the usual options for checking sensor details such as software versions, as well as setting the zero offset.

To calibrate (a zero offset in this case), you’ll go ahead and tap the Calibrate button, while being unclipped from the unit. Keeping the cranks vertical seems to work out best:

Note that often times I do two calibration (offsets) back to back, rotating the crankset once in between. I like to ensure it gives the same reading. This is a bit of a habit coming from doing lots of power meter testing, and I feel like it produces more stable results here.

The app has many of these same functions as well. For example, you can pair to your pods and check everything from temperature to battery.


Also, down the road, you’ll be able to have multiple bikes assigned (with corresponding calibration values). This would allow you to buy a second set of sensors, and then ‘simply’ swap the pods between bikes. This would be akin to swapping Vector or BePRO. Not quite as fast as a simple pedal swap like the PowerTap P1, but still well under 5-7 minutes once you get efficient at it.


You can also set the zero offset here, as well as even do a live check of signal strength and gain. Plus you can monitor the pedals live (for cadence/power), in the event of troubleshooting or such.


(Administrivia Note: The above crank length was showing as 172.5 in the app even though my crank length is 175mm, because I took these screenshots with the Gen2 production version of the app after having done setup with the beta app before it was released to the app store, so it didn’t carry over my settings in the app itself. The cranks themselves were configured though as 175mm.)
Ok, with all that configuration stuffs out of the way, let’s talk about general usage. Once pedaling out on the road the unit will be broadcasting the following specs:
ANT+ Power (total)
ANT+ Power Balance (left/right)
ANT+ Cadence
ANT+ Pedal Smoothness
ANT+ Torque Effectiveness
Bluetooth Smart Power
Bluetooth Smart Power Balance
Bluetooth Smart Cadence
You can see this detail on the head unit itself of course, or afterwards on various platforms depending on the capabilities of the platform. For example using the baseline of Garmin Connect, here’s what you’ve got for a ride. Whereas if you pair to Suunto’s platform you won’t get some of the additional power meter metrics beyond baseline power, since Suunto doesn’t support those. Meanwhile, Polar sits somewhere in the middle on support of advanced metrics.

With all of the operational use things out of the way, let’s dive into the accuracy pieces.
Power Meter Accuracy Results:
I’ve long said that if your power meter isn’t accurate, then there’s no point in spending money on one. Strava can give you estimated power that’s ‘close enough’ for free, so if you’re gonna spend money on something it shouldn’t be a random number generator. Yet there are certain scenarios/products where a power meter may be less accurate than others, or perhaps it has known edge cases that don’t work. Neither product type is bad – but you just need to know what those use/edge cases are and whether it fits your budget or requirements.
Still, WatTeam certainly hopes to be in the camp of accuracy found with other power meters that are regularly recommended. But do they have that level of accuracy?
Well as always I set out to find that out. In power meters today one of the biggest challenges is outdoor conditions. Generally speaking, indoor conditions are pretty easy to handle, but I still start there nonetheless. It allows me to dig into areas like low and high cadence, as well as just how clean numbers are at steady-state power outputs. Whereas outdoors allows me to look into water ingest concerns, temperature and humidity variations, and the all important road surface aspects (i.e. vibrations).
In my testing, I generally use between 2-4 other power meters on the bike at once. I find this is the best way to validate power meters in real-world conditions. In the case of most of these tests I was using the following other units:
PowerTap G3 hub based power meter
4iiii Precision dual (left/right) power meter
Tacx NEO Trainer
CycleOps Hammer Trainer
In general, my use of other products is most often tied to other things I’m testing. In this case, I was testing both the WatTeam and 4iiii’s units more or less concurrently. I had two sets of WatTeam power meters to work with, one installed on the 4iiii crankset, and one on a second crankset that wasn’t equipped with the 4iiii dual system. When it comes to data collection, I use a blend of the NPE WASP data collection devices, and a fleet of Garmin head units (mostly Edge 520/820/1000 units).

Note all of the data can be found in the links next to each review. Also, at the end is a short table with the data used in this review. I’ll likely add in other data not in this review as well once I finish consolidating that data. I’m a bit behind on getting data off some of my head units into folders.
With that, let’s get started with an indoor test (data here). This one was on the CycleOps Hammer with TrainerRoad controlling it. Note that this was done prior to a Hammer firmware update that addressed some of the spikiness, so don’t mind that too much on the Hammer. Here’s the overall ride, which was 30×30’s (30 seconds hard, 30 seconds easy). Here it is without smoothing:

And here it is with 10-second smoothing. Note that I will usually show/note the charts with smoothing, merely because it allows us to easily pick out variances that shouldn’t be there.

Now, ignore the random Hammer power drop there, that was something on the recording unit side. That’s fine and non-relevant. Instead, simply focus on the fact that throughout this all three units agree quite nicely. Said differently: Happy.
One thing you may wonder about is that very last second spike. This was actually just me pedaling for about 2 seconds, causing this spike. But you do see some slight differences in measurement. For a 2-second long pedal-stroke, you’re simply going to see variations in max power on any power meter and recording device. That’s normal.

Next let’s look at a Zwift session, non-ERG mode. This is notable because it’s more variable than a TrainerRoad workout given I control my power output based on gearing. It thus allows for more fluctuation. Here’s the high-level overview:

Again, things look pretty good here. If we zoom in on one of the sprints (smoothed at 10-seconds), you’ll notice the WatTeam unit is slightly below the others. It matches it otherwise, but is a bit low on the sprint.

We see the same thing in another sprint a bit later. Perfectly fine going in/out of the sprint, but the peak is just a bit low:

Out of curiosity, I took that same peak and broke apart the left and right power from 4iiii and WatTeam. It appears like the right side is slightly under-measuring the sprint side for this effort.

Note that there were some oddities later in this same file where the WatTeam dropped out, however I believe that may have been battery related and not unit-related. Thus, I’m not holding it against them, since it’s likely just a case of me forgetting to charge one of the pods.
Next, let’s head outside – where the rubber meets the road. This was a 90 or so minute ride across a bunch of rather varied terrain – including both smaller and larger cobblestones. Here’s the full view at 20s smoothing:

Now let’s zoom in one one of the peak sprints:

Here we see WatTeam again under a bit on the sprint – by about 50w compared to both 4iiii and the PowerTap. If I pick another point, we see the same thing (below), by roughly a fair chunk. What’s interesting though is that that middle peak is missed, but the less intense one isn’t. It tracks that quite well.

So what if I remove the smoothing on these two, and show you what’s happening a bit deeper? Here you can see that it’s able to track the lower power surges, but seems to second-guess itself on the major ones. It’s almost 100w off here:

And that’s pretty consistently what I’ve seen. For any surges (even sharp ones), under about 700w, it tracks it quite nicely. But above that, it lags a fair bit more. Below, is another example from that same ride. Back to back surges, the first at 800w it decouples entirely. Whereas the second a few seconds later at 700w tracked just fine (the fact that you see slight variances is just a result of recording/transmission normalcies).

So I went back to WatTeam about this, and it sounds like it’s something they are aware of. They noted they could address it within software via one solution to inflate the power value on certain sprints, but doing so may not yield the desired result. Sort of the ‘every action has a reaction’ kind of thing. That’s not really want anyone wants.
But I do agree they could probably fix this down the road. It’s just a question of how far, and will it remain accurate otherwise.
Finally, one last area I saw some minor trouble with is larger cobblestones. Obviously, Paris being an older European city has plenty of pave and cobblestones around. But not all are the same. Some cobbles are relatively minor, while others are bone-jarringly bad. For the normal/minor ones, WatTeam does just fine. High-speed, low-speed, doesn’t matter. However, for the bone-jarringly bad ones, it also shook up the unit. You can see this below, where it dropped out:

However, I wanna point out and be really clear – this is one section that I despise riding on. It’s not anything you’ll find anywhere common in Paris, or in 99.99999% of roads in the US. It’s just a nifty little test section that I found that’s fun for tests like this. And to be fair, almost all other power meters pass this test (LIMITS did not, neither did earlier versions of the PowerPod software).
Lastly, let’s finish up with a ride earlier this week. For this ride I was out doing a relatively steady-state effort of loops for an hour, eventually increasing intensity for a 20 minute period. All-in the ride was 2 hours. This was interesting because it was at sunset, where the temperature starts to shift quickly (colder), which is always an interesting area to test. Here’s the entire ride, smoothed at 30s:

In general, things look pretty good at the high level. If I zoom into that 20-minute section, you’ll see a bit of variability in the data actually. The PowerTap G3 seems to occasionally run a bit high at times, which is highly unusual (especially since it was auto-zero numerous times during coasting during the ride).

In any case, let’s focus back on some of those harder efforts earlier in the workout. I’ve reduced the smoothing rate to 5-seconds. First is the initial spike, the WatTeam and 4iiii matched near identical, while the G3 actually went a bit high.

Meanwhile, the second spike you see them closer, albeit still slightly separated. Still, nobody is completely out in left field. As is always the case, anytime you sprint due to recording/transmission nuances you’ll get slight differences.

In general actually, this ride went pretty well for WatTeam, and there’s nothing sticking out of concern in this particular ride. One could make arguments in fact that the PowerTap G3 had some minor issues on this ride. But that’s hard to say definitely, and it’s incredibly rare for me to see the PowerTap G3 have issues. You can see by looking at the Mean/Max graph that it tracked very nicely:

So where do we stand on the accuracy front overall? Well – essentially all is well unless you find yourself in one of two conditions:
A) Brief sprints above 700w seem stunted
B) Really nasty cobblestones cause issues
The first one is likely a bigger issue for road cyclists than triathletes, who would be more likely to give an all-out effort during a sprint. Whereas triathletes tend to have more steady-state efforts. And then the second item on rougher roads is unlikely to impact that many people. For just normal non-brutal cobblestones it’s not an issue.
In any event, here’s the table of the data presented above, plus a few extras I didn’t dive into. You can click any of the links to use the Analyzer and dive deeper into the graphs. Or you can simply download the actual original data files and do your own analysis.
WatTeam PowerBeat Gen2 Data Sets
IndoorsAnalyze4iiii Precision Dual, WatTeam Gen2, CycleOps Hammer, TrainerRoad ControlIndoorsAnalyze4iiii Precision Dual, WatTeam Gen2, CycleOps Hammer, ZwiftIndoorsAnalyze4iiii Precision Dual, WatTeam Gen2, CycleOps Hammer, ZwiftOutdoorsAnalyze4iiii Precision Dual, WatTeam Gen2, PowerTap G3 HubOutdoorsAnalyze4iiii Precision Dual, WatTeam Gen2, PowerTap G3 HubOutdoorsAnalyze4iiii Precision Dual, WatTeam Gen2, PowerTap G3 Hub
Note that the above data is charted/plotted using the DCR Analyzer tool, which is designed specifically for comparison of sensor data such as power meters. You can read more about it here, as well as leverage it for your own tests.
Power Meter Recommendations:
With so many power meters on the market, your choices have expanded greatly in the last few years. So great in fact that I’ve written up an entire post dedicated to power meter selection: The Annual Power Meters Guide.
The guide covers every model of power meter on the market (and upcoming) and gives you recommendations for whether a given unit is appropriate for you. There is no ‘best’ power meter. There’s simply the most appropriate power meter for your situation. If you have only one type of bike I’d recommend one power meter versus another. Or if you have different needs for swapping bikes I’d recommend one unit versus another. Or if you have a specific budget or crankset compatibility, it’d influence the answers.
Now since the guide came out this past fall, there really hasn’t been any major entrants in the market that weren’t already covered in that post. However, there have been two noteworthy changes:
A) WatTeam PowerBeat Gen2 (this post): In general, I’m good with this unit. I think there are still some quirks in edge cases like really rough cobblestones (general road roughness seems fine), along with some issues on harder sprints (whereas general increases in power seem fine). I’d say for triathletes it’s good, as sprints aren’t exactly common out on the road. Whereas if you’re a sprinter on a road bike…this might not be the right choice for you.
A) 4iiii Precision Dual: The post in my annual power meter guide didn’t cover the accuracy aspects of the left/right setup, so I didn’t dive into general recommendations. But given the data in my in-depth review (and even here in this post too) – I think it’s safe to say I have no issues with recommending the 4iiii Dual as a dual left/right setup.
Oh, and technically, there has been a third entrant – a company called Arofly – introduced a small accessory ‘power meter’. I’ve got one that arrived this morning here in Paris. It’s priced very cheap, but I’m extremely hesitant to say it’ll be accurate until I’ve tested it. There’s a lot of questionable claims made on their site, starting with fabrications about their pro athletes and coaches and credentials (they aren’t pro, and they don’t exist). As such, where there’s smoke…there’s fire. Still, perhaps the tech will be better than their truth-telling skills. Once I get it all unboxed and onto the bike, I’ll let y’all know what the deal-e-o is with it.
Summary:

In many ways WatTeam has succeeded at their goal – they brought forth a dual-leg capable power meter below $500 – something that nobody else has done. The installation is far easier than it was a few years ago at their outset, and they have put together something that the vast majority of people who can make cookies at home can follow to install a power meter. Unless you only do the cookies from the can where you cut it into little slices (but let’s be honest, those cookies are great too).
Of course – as noted in the accuracy section, it’s not perfect. In particular on sprints, roughly above 700w. If you aren’t sure if you can throw down 700w, the answer is likely no (though, perhaps you’re discovered). Which isn’t to say I’m all that powerful (I’m not), but that most people who can output 700w for anything more than a second or two tend to know it. Still, it’s important to many – be it one second or 30 seconds. For triathletes or those at lower-level steady-state power? Probably not.
Ideally, we’d see WatTeam address this shortcoming with a simple software update, and I suspect they probably can in time. Specifically, I suspect it’ll take more real-world consumer data in their pockets to understand how to separate the noise at these levels. Which isn’t all that unusual for power meter companies. Heck, even the usual rock-solid Quarq had to issue a firmware update last month for their new DZero power meter after dropouts during sprints were caused by a bug.
If they can get there (sooner rather than later), then we’ll see another drop in prices by competitors. They’re very close – and I wouldn’t have any issue recommending these to those doing steady-state focused power sessions. Or for those that simply can’t produce 700w+ (for example, these would work just great for The Girl). And realistically, many times I’ve demonstrated that even single-leg units (i.e. Stages or other one-leg options) can be off in total by more than WatTeam’s dual setup at super-high wattages, due to leg imbalances.
With that – thanks for reading!
Found this review useful? Or just wanna save 10%? Read on!

Hopefully you found this review useful. At the end of the day, I’m an athlete just like you looking for the most detail possible on a new purchase – so my review is written from the standpoint of how I used the device. The reviews generally take a lot of hours to put together, so it’s a fair bit of work (and labor of love). As you probably noticed by looking below, I also take time to answer all the questions posted in the comments – and there’s quite a bit of detail in there as well.
I’ve partnered with Clever Training to offer all DC Rainmaker readers an exclusive 10% discount across the board on all products (except clearance items). You can pick up the WatTeam PowerBeat from Clever Training. Then receive 10% off of everything in your cart by adding code DCR10BTF at checkout. By doing so, you not only support the site (and all the work I do here) – but you also get a sweet discount. And, since this item is more than $49, you get free US shipping as well.
WatTeam PowerBeat Gen2
Thanks for reading! And as always, feel free to post comments or questions in the comments section below, I’ll be happy to try and answer them as quickly as possible. And lastly, if you felt this review was useful – I always appreciate feedback in the comments below. Thanks!