Basis B1 Watch In-Depth Review
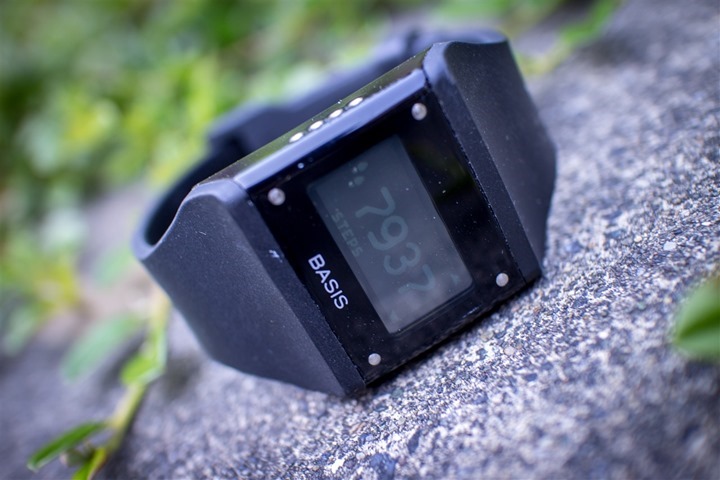
The Basis B1 watch represents the first fitness tracker on the market to do 24×7 continuous heart rate monitoring (all without a heart rate strap), in addition to all of the usual metrics like a step-counter and sleep. Adding to that, they also measure skin temperature and perspiration. But does the long-awaited watch that hit the market a few months ago actually live up to expectations? Or is it just a bunch of geek-like data with no context? Well, I dug in to find out.
I’ve been using the device for months now, wearing it day and night. Because I want to be transparent about my reviews, once my evaluation period with the Basis unit has elapsed, I send it back to Basis in San Francisco. Simple as that. Sorta like hiking in wilderness trails – leave only footprints.
Lastly, at the end of the day keep in mind I’m just like any other regular triathlete out there. I write these reviews because I’m inherently a curious person with a technology background (my day job), and thus I try and be as complete as I can. But, if I’ve missed something or if you spot something that doesn’t quite jive – just let me know and I’ll be happy to get it all sorted out. Also, because the technology world constantly changes, I try and go back and update these reviews as new features and functionality are added – or if bugs are fixed.
Unboxing:
First up on our journey to enlightenment is getting the thing unboxed. Thus, the box:
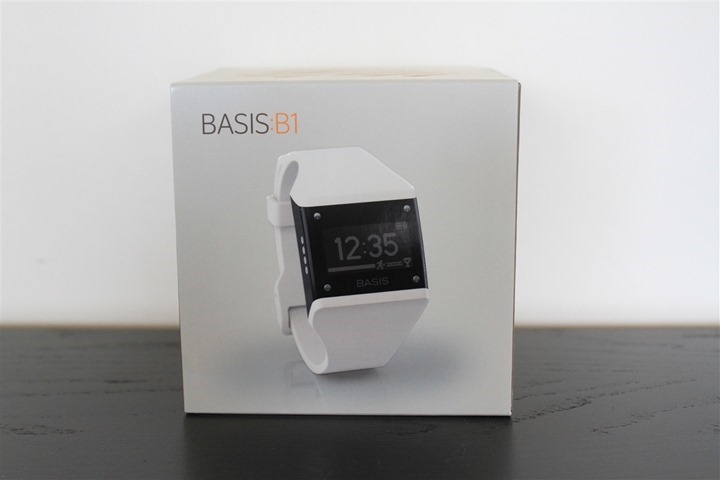
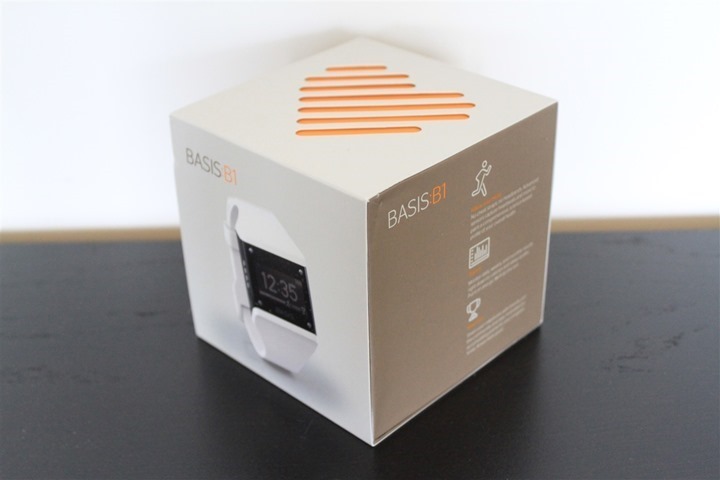
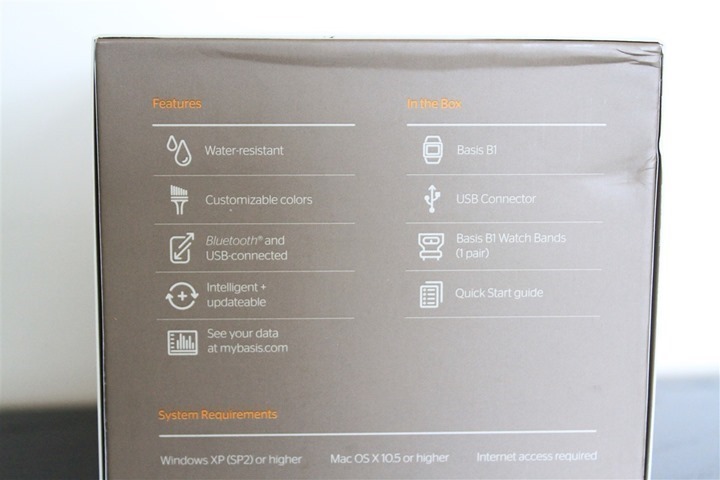
I thought it was slightly interesting that the box noted Bluetooth connectivity about 3 months before it actually had any Bluetooth apps available…
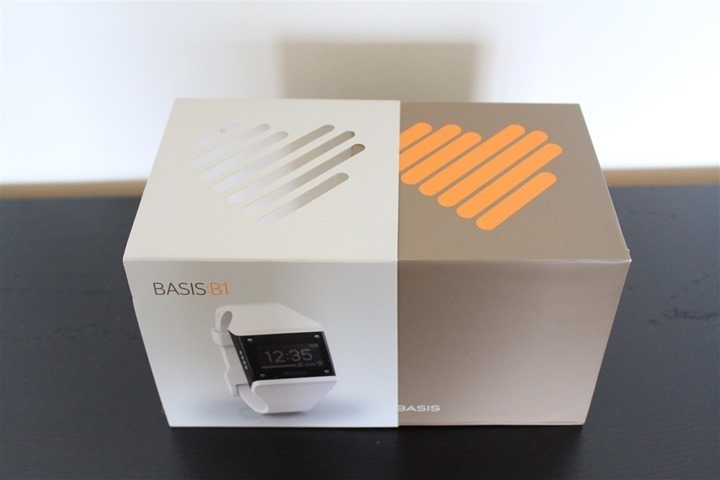
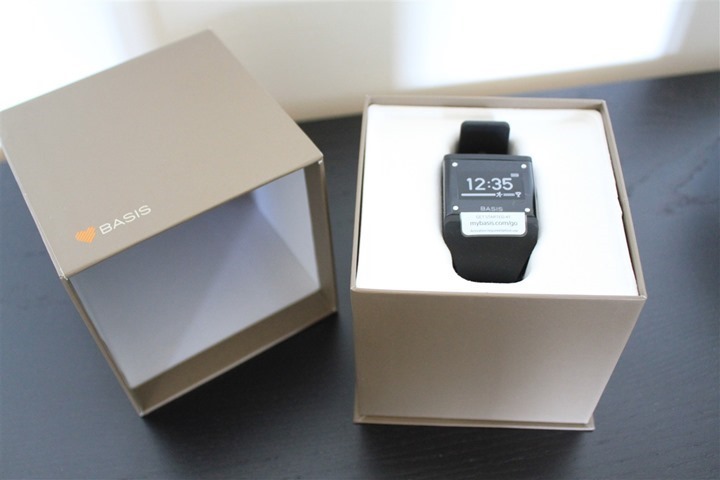
There’s actually an inner box inside the shell of the outer box. You’ll want to pull the inner from the outer.
Then there’s yet another box inside the inner box. It’s like one of those little Russian wooden dolls. Inside that, you’ll finally find the watch looking up at you.
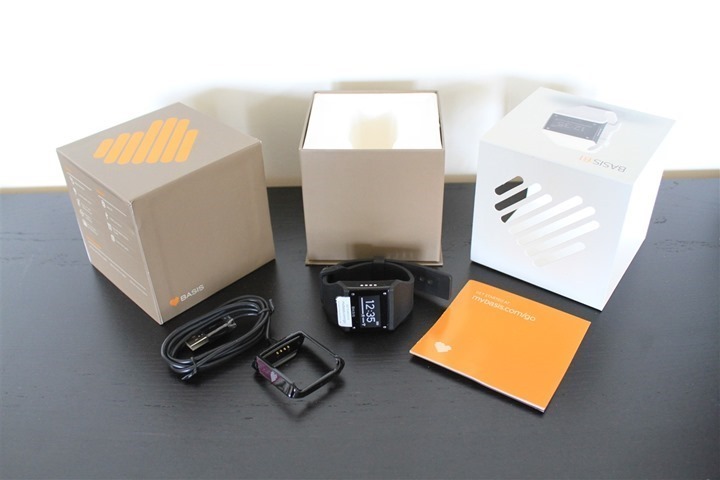
Below the watch is the charging cable and a tiny little paper manual. Here’s what the whole kit looks like once unboxed:
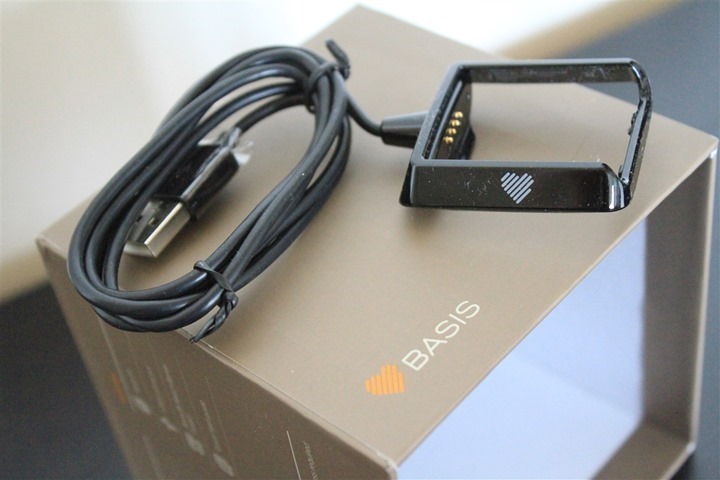
Taking a slightly more detailed look at the components, here’s the charging cable. This USB cable is for both charging as well as syncing of your fitness data via the Basis Sync agent (which is software you install on your computer).
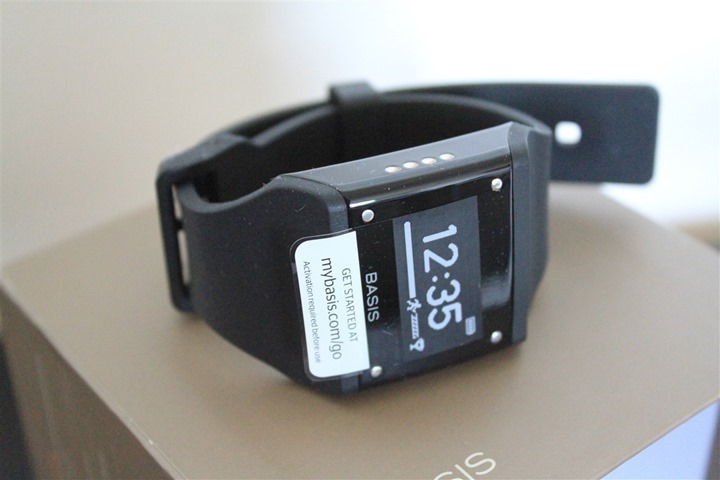
Then we’ve got the watch itself. In the picture below you can see the four little charging contact points on the edge of the watch. This is where the cradle snaps in and connects.
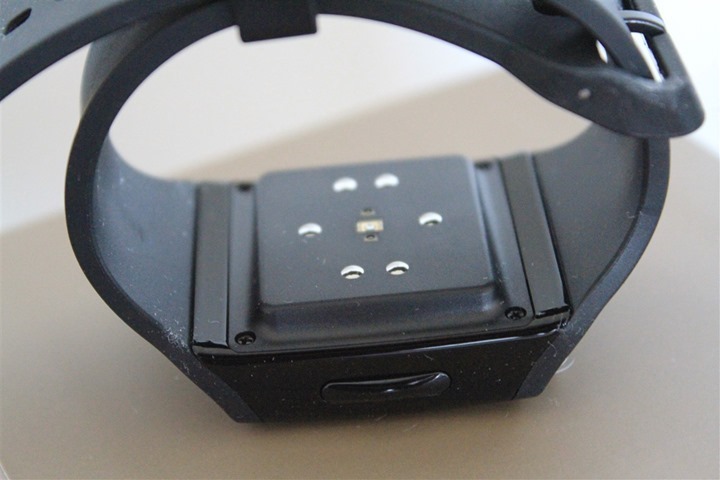
Flipping it over you’ll see the sensors on the underside. This is obviously the side that touches your skin, allowing it to gather heart rate, skin temperature, and skin perspiration metrics.
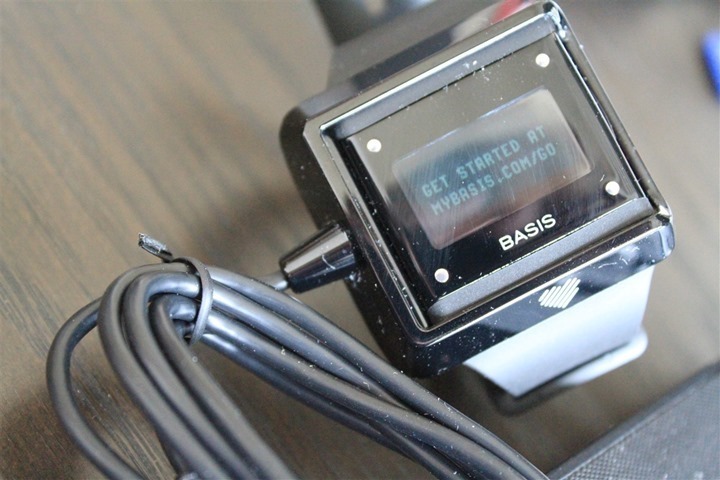
Once you’ve pulled off the little plastic protector and added some USB power (thus turning it on), it’ll prompt you to go out to the Basis site and grab the software to get the unit cooking.
With everything unboxed, let’s dive into how it compares to other units in the field from a physical standpoint.
Size Comparisons:
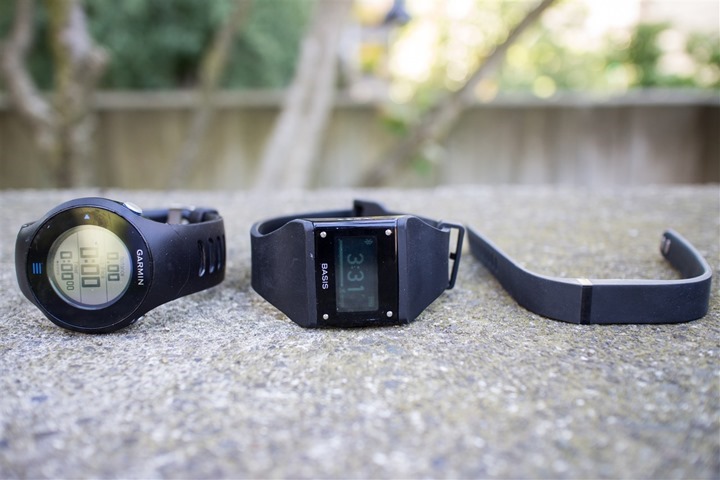
The Basis watch is pretty normal sized when it comes to watches. It’s neither big, nor small – it just sorta sits in the middle size-wise. Here’s a look at how it compares to a running-specific watch, the Garmin FR610:
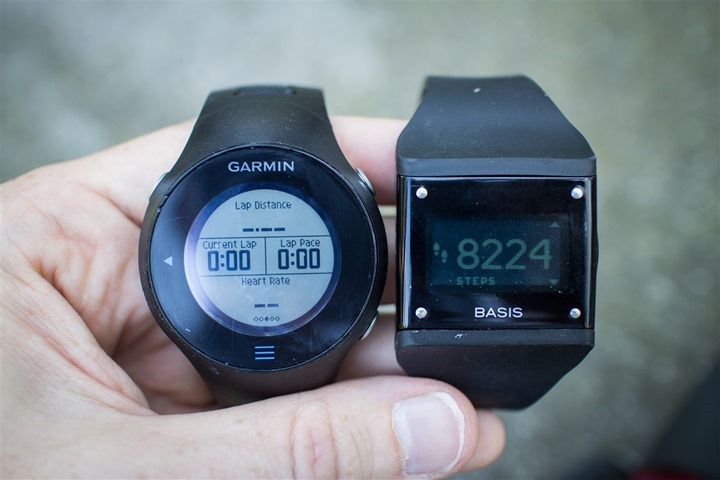
As you can see, the height of the watch is a bit higher than most other units on the market, thus making it look a bit more bulky than it really is.
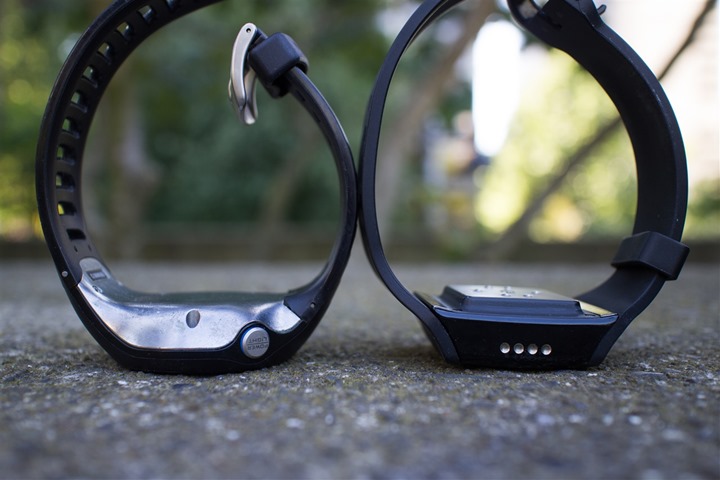
I suspect that much of this vertical bulk comes from the platform behind the varying sensors that are contained within the unit – such as the optical and skin temperature sensors.
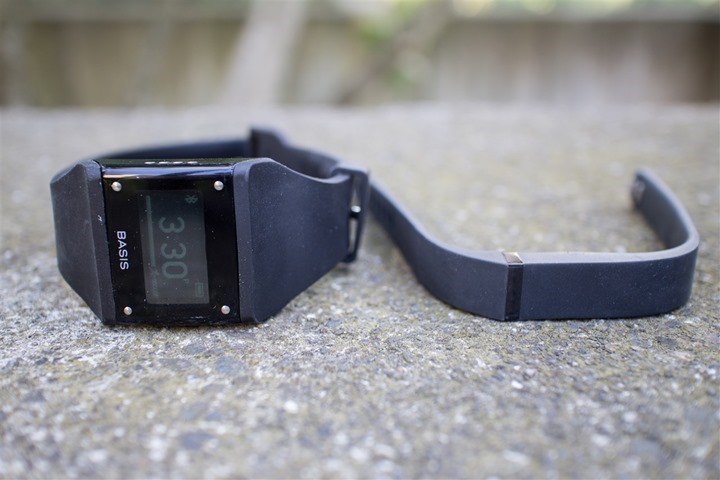
When you compare it to other fitness trackers on the market you have to take into account that this is in a very different form factor than others. Most other units fall into one of two camps: Either waist band worn, or wrist worn. But for the wrist-worn ones, all of the others on the market are focused on looking more like a bracelet than a watch.
Thus size-wise, the Basis is definitely amongst the biggest on the market since it includes a full watch face, versus just having no display, or minimal time display. At the same time, the others on the market also don’t have the optical or skin sensors, which require a larger/flatter base to function. You can see the difference below between the Basis wrist watch and the Fitbit Flex wrist bracelet.
And finally, comparing to waist worn units (such as the Fitbit Zip) is like comparing watermelons to strawberries. Nonetheless, to put things into perspective, here ya go:
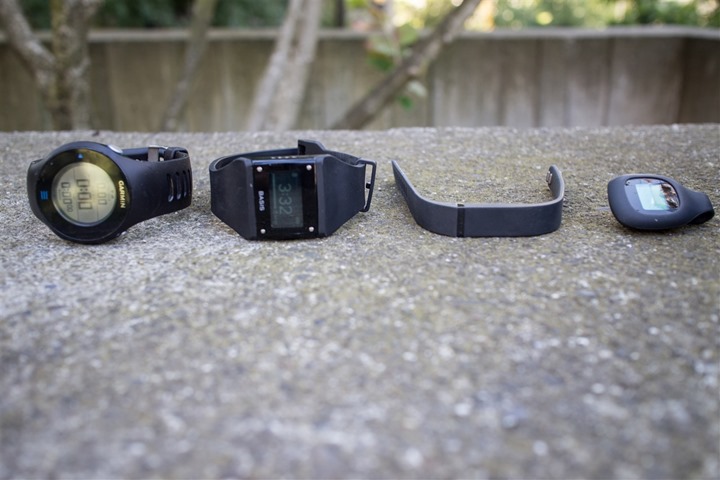
Obviously the activity tracker location is going to come down to personal preference. Do you prefer wrist or waist? I find that wrist tends to be better from a motivation standpoint (since it’s always there and visible). Additionally, wrist tends to be easier to remember if you switch pants. On the flipside, the waist units tend to have a much longer battery life, and thus the impact on neglecting to charge it frequently can be negated. Again, largely a personal preference item. Also note that when I say ‘waist’ I’m largely referring to all clip-on units, which can be worn on your waist, pockets, and for women usually clipped on your bra.
General Use:
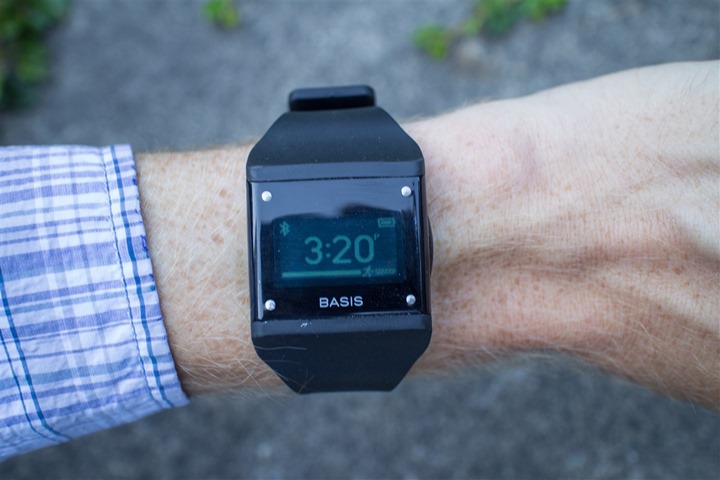
The very first question most people ask is how tight you have to wear the watch. In my use, I’ve found that I haven’t had to wear it any tighter than I would wear any other watch. In general, it doesn’t leave any marks on my arm post-use.
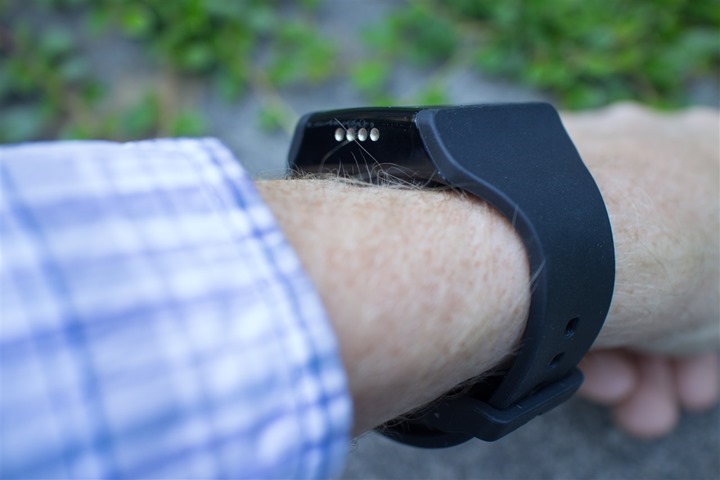
Once you’ve got the unit on your wrist, you’ll be ready to roll. The unit itself actually has very little that you can do to it, or display from it. There are four small button on the top – each being those little silver dots you see. The upper left button turns on the backlight. The lower left button swaps between date and time:
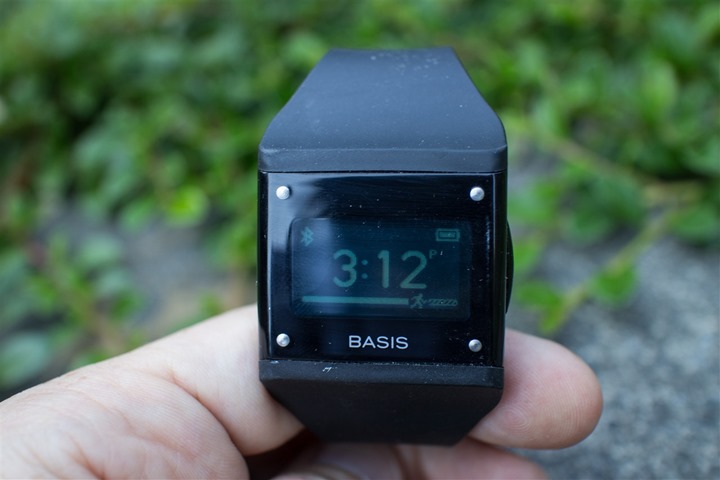
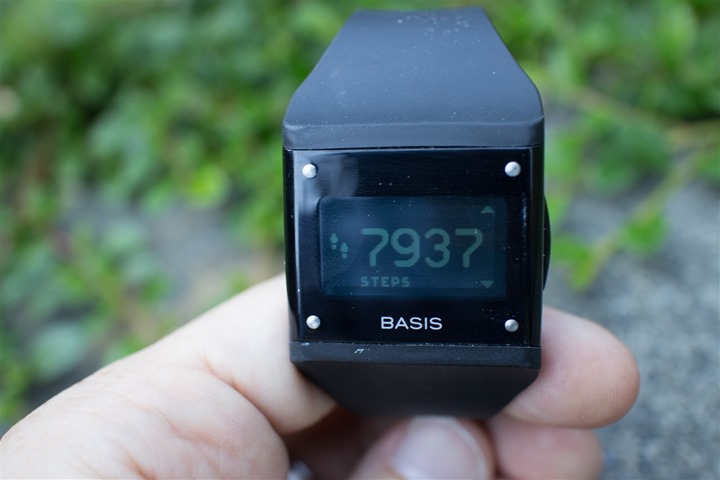
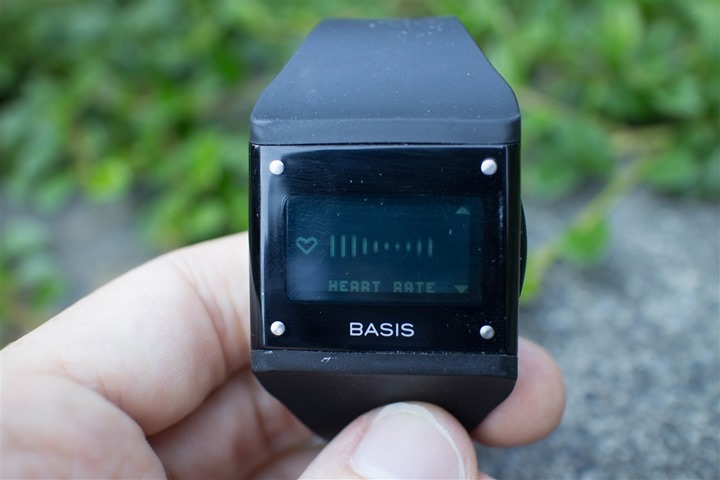
And the two right buttons iterate between the three data fields that you can display: Calories, Steps, and Heart Rate.
From a button standpoint, lastly, the side button triggers the Sync menu:
But I’ll cover the Bluetooth Sync piece a bit later in the phone synchronization sections.
Finally, the band does actually break apart. The idea behind that being to allow you to swap out band colors. The problem here is that I’ve also had it break apart for no particular reason, causing the watch to fall to the floor. For example, I somehow got it caught on my freezer door one day while opening it and it broke apart. Go figure.
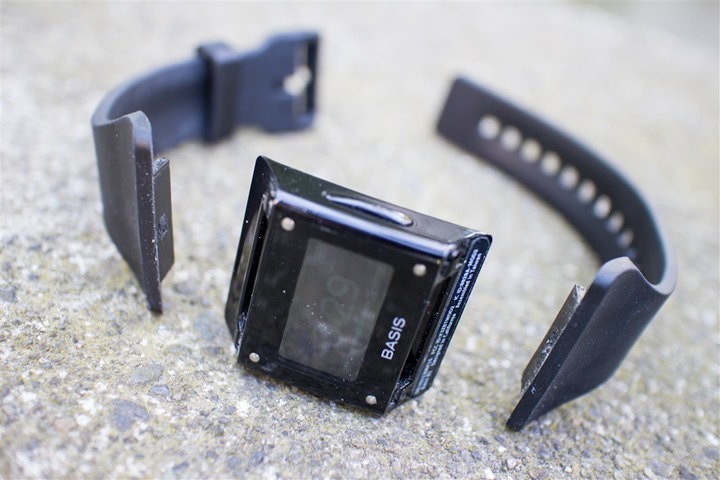
Additionally, this little area between the watch and the bands seems to be a haven for dead skin, dust, and god knows what else. It wasn’t pretty when I opened it up recently:
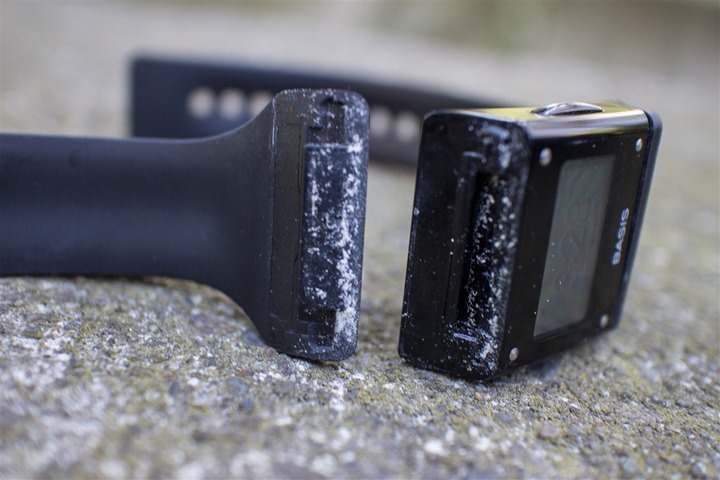
Nonetheless, the band falling apart has only happened to me a few times, and each time the unit came away from the experience seemingly functional.
Step Counter:
Like most activity trackers on the market, the B1 includes an internal accelerometer that allows it to measure steps. This is one of three metrics (Steps/Heart Rate/Calories) that are available to appear on your wrist with the tap of a button.
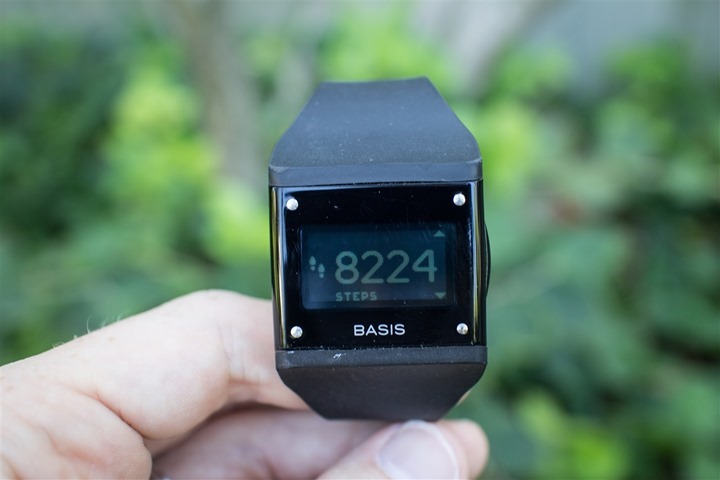
As you walk around over the course of the day that will increment, in turn causing your progress bar towards 10,000 steps to increase:
Later, this is available on the site for deeper analysis:
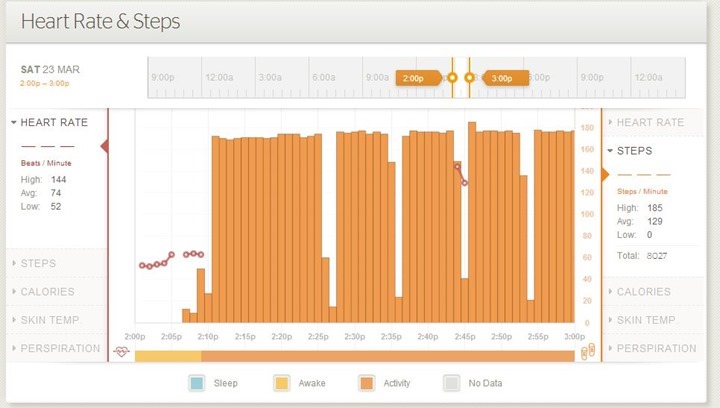
On the left you’ll see the high steps per minute I made, as well as the average, low and totals for the time period. In this case, I’ve constrained my time period to be the time I was awake that day.
If I zoom in further, you’ll see the scale change a bit from larger time chunks (15-30 minutes) to much smaller chunks (one minute):

In talking with Basis, I confirmed that while the data is recorded at levels sub-1-minute, it is only displayed at the 1-minute interval, as you can see below.

Step Counter Accuracy:
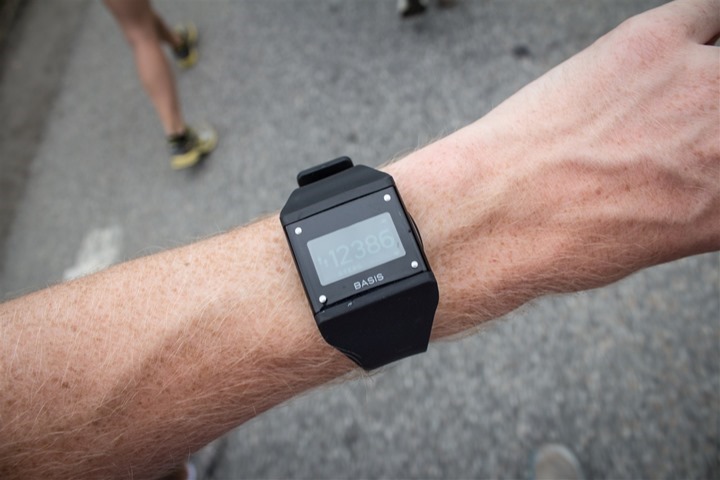
Anytime a device records a value I like to validate that the value is actually accurate. In the case of distance related values, that can usually be accomplished by measuring a preset course and validating the unit against that – or against other ‘known good’ units. With the case of the step counter, there’s two basic types of tests. First is an outright step counter against a simple known step value. In this first step I just simply walked 100 steps and then checked what the value was of each unit.
For my ‘comparison tests’, I used two other devices, both waist-worn units. The first was the FitBit zip, and the second the Withings Pulse.
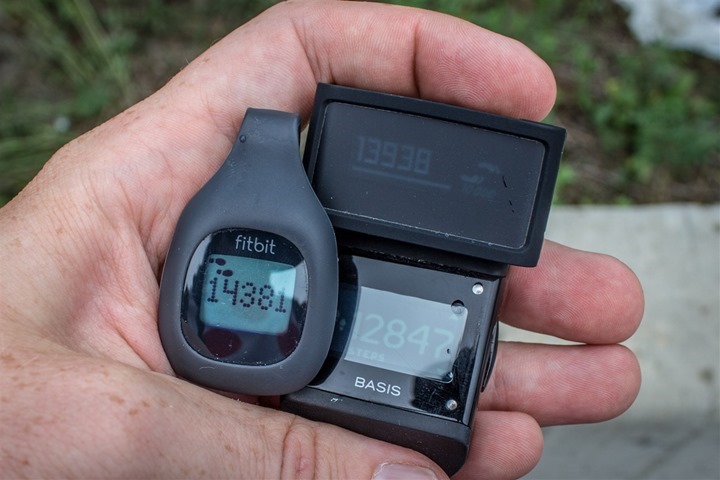
Looking at the 100-step test, here’s how they each fared:
Test #1 – With Basis on my right wrist:
Basis B1: 99 steps
Fitbit Zip: 101 steps
Withings Pulse: 100 stepsTest #2 – With Basis on my left wrist:
Basis B1: 98 steps
Fitbit Zip: 101 steps
Withings Pulse: 102 steps
Not to shabby actually, pretty darn accurate given everything. Both tests were simply a walk across a parking lot.
Next up was a series of tests over the course of about a week, comparing data against the three devices. In these cases I did not wear the device during any of my scheduled runs, but instead focused purely on “the other 23 hours”.
First three days, with the Basis on my left wrist:

Next six days, with the Basis on my right wrist:
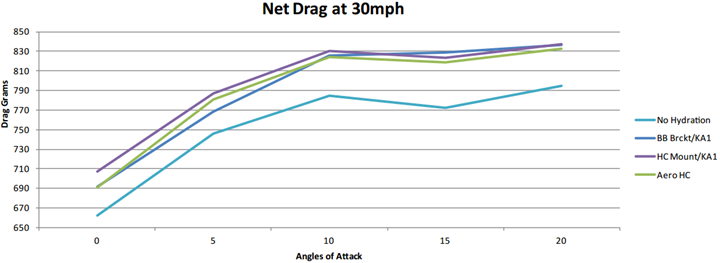
(Note: I have no idea why the Fitbit Zip seems to have such oddly high numbers for Tuesday)
As you can clearly see, the unit appears far more ‘accurate’ on my right wrist than left wrist. This is somewhat problematic for me in that I prefer wearing watches on my left wrist (I’m right-handed). In 5 out of the 7 days as noted above, I had friends that were with us almost 24×7, and interestingly, they had more traditional step–counters on them. While our steps were obviously not identical, I did find that the Basis unit was in the ballpark of their units on the days when I wore it on my right wrist, but like my own data – it was skewed significantly off when on my left wrist. The one exception was Friday, where you can see the Basis unit was substantially lower. Very odd, with no logical explanation.
Thus I’d encourage you to do some simple tests (like the 100-step or similar test) to see which wrist gives you the most accuracy. Interestingly, when looking back at my Nike+ Fuelband review, doing the 100-step tests I saw much greater variation than I did with any of the units here.
Heart Rate (Optical):
Perhaps the most interesting part of the Basis B1 watch is its ability to measure heart rate optically. This means that you don’t wear a traditional heart rate strap and instead the sensors on the inside of the wrist strap will measure heart rate for you. This is accomplished by measuring changes in blood flow within your capillaries. In doing so it’s measuring the reflection of light emitted by the green sensor. By doing that they can discern heart rate.
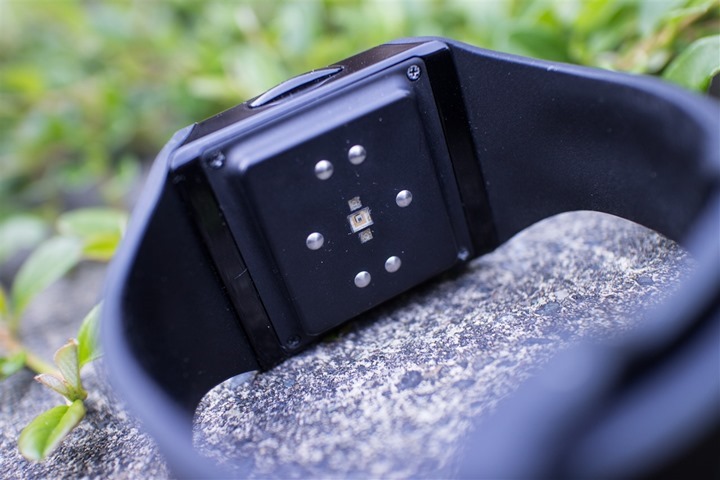
This method works well in most conditions the unit is targeted at (the 23 hours of the day you’re not working out), but there can be some hiccups. In general, erratic movement tends to be an issue, producing potentially erroneous results. I haven’t seen anything substantial, but certainly occasionally questionable. For example, it’s not going to spit out at 180 BPM value simply because you swing your hand while sitting at your desk. But it may be slightly higher than it should be.
Once it contacts your skin, the unit will trigger its green optical sensor lights, which you can see coming out the center of the watch:
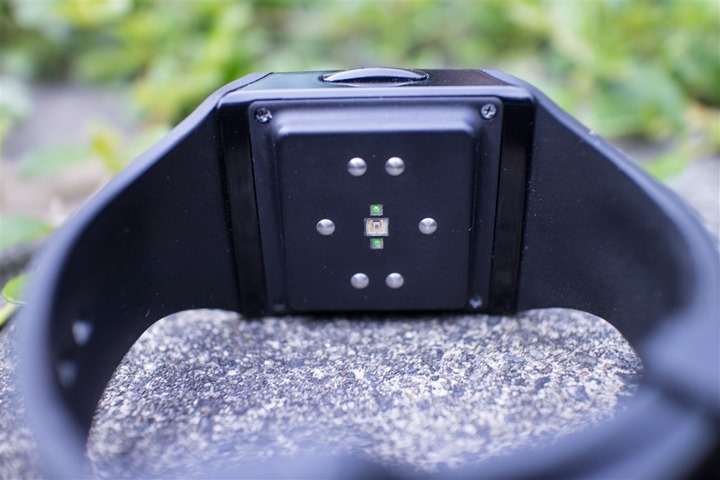
The value displayed on the screen tends to be fairly lagged, as well as seemingly quite smoothed (likely to reduce the measurement imperfections). I’ll get into the sports aspect in the next section. In general I find that the unit is able to determine and lock in on your heart rate value far quicker than the Mio Alpha watch. And while doing day to day activities I find it within the same ballpark as a traditional heart rate strap (again, not inclusive of sports).
The key item to remember here is that because the Basis unit is doing 24×7 tracking, it’s not super critical that it be perfect every second of the day. At the 24×7 level you’re really looking more at trends. After all, as I sit here typing this my heart rate is showing 58 BPM, but if I get up from the table and go into the Starbucks it may be 80 BPM. Now, when I step back and look at the data four weeks from now I’m unlikely to remember what I was doing at 10:11PM on Wednesday versus 10:13PM. Thus by extension, it’s more about trending than it is about absolutes.
With that in mind, the Basis site allows you to look at the heart rate data down to the average for any given minute. It can be really interesting to start evaluating those trends. Take today for example. I’ve overlaid heart rate against steps.

Above you can see the course of my day. You can see I slept till about 6:45AM, where while sleeping my HR was relatively low and stable. Then it rose as I drove into work, but then calmed down for much of the day. I was in a single meeting room all day doing all-day meetings, so there’s very little activity on my part today. You see a small spike around 1PM as lunch time hit and I wandered about for lunch within the building. Then calm again. Then at 5:30PM I went out for a run. I didn’t wear it while running, so you see the gap there. Post-run you see elevated HR, but it’s not actually because I was tired from the run. Instead, it’s because I was at dinner and having lots of discussion. Finally, around 9PM you see it calm back down again, as I’ve been typing since then.
It’s this trending that makes the HR aspect so interesting. Now compare this to one week prior, the day I went and spectated the Tour de France at Alpe d’Huez. In this case, you can see how the watch fails to track HR while I’m walking up the mountain. And strangely, in one case seems to fail tracking HR while I’m driving (10:30AM-11:30AM). You can see the random HR data points that it does gather here and there, but overall while I’m walking there’s not much there.

Looking at another day, Monday, you can see a day where I flew for 12 hours. This was shown on European time, so when I landed in San Francisco I had to adjust (did that the following morning). So what you see here is my getting to the airport, then at 10:30AM boarding the plane, and then basically no movement for 12 hours. In reality I got up a few times, but otherwise those don’t really show given how few steps it was. You can also see the two dips around 11:30AM and 8:30PM where I fell asleep briefly for about 30-45 minutes – producing a low ~40 BPM HR value.

Ultimately, the heart rate display piece is probably the most well done component of the watch. While the data accuracy is questionable in high-movement pieces, it’s otherwise really interesting data to look at.
For me, I use the resting HR values (which I’ll talk about in the sleep section) to help me determine how rested or exhausted I am, and thus, the impact on training load.
Heart Rate Use in Sports Activities:
The executive summary version of this section is that it simply doesn’t work.
The long form version is that the Basis B1 was designed “for the other 23 hours of the day”, and as such the optical heart rate measurement has significant issues when it comes to accurately tracking heart rate at elevated levels associated with sports activities. Much of this originates from the fact that the optical heart rate sensor within the unit simply hasn’t been tuned to the constant and sharp movements associated with sports activity. This is different from the Mio Alpha watch, which has been tuned for sports activity, but doesn’t really work for the remainder of the day.
In many ways, I wish the two units were merged together a bit, as it’d be great for the Basis B1 to have more flexibility in this area.
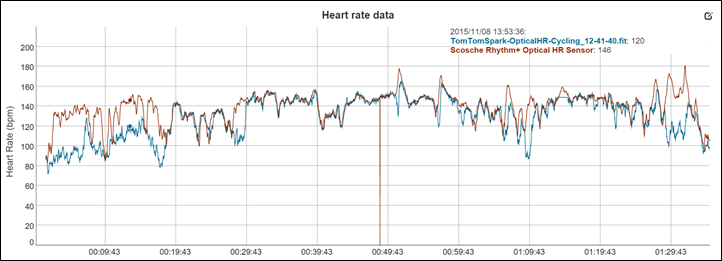
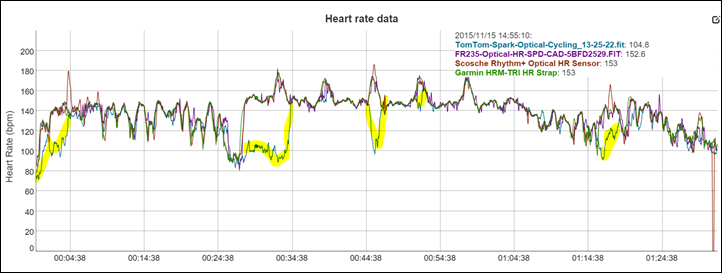
While running, you’ll see that the HR data tends to either be complete garbage, or simply too laggy to be of use.
Even while cycling indoors on a trainer I’ll see cases where my actual heart rate would be 150BPM, and the Basis unit thinks it’s 110BPM. I would have expected in these scenarios (sitting on a trainer), it would work better, but alas, it doesn’t.
Skin Temperature & Perspiration:
While Skin Temperature and Perspiration are technically two separate metrics, I’m going to cover them in a single section. If for no other reason than to make this section slightly longer. I say that because it’s hard to cover a section which has so little information about it. By little, I mean none.
The unit actually won’t display skin temperature or perspiration on the display. Instead it’s only displayed afterwards online within the Detail pages.

In my mind, this information is sorta like the new Withings Scale that takes the air quality of your bathroom. There’s really nothing actionable about it. I can’t do anything with it as it stands today and say “Oh, my skin temperature is high, let me do XYZ”.
Previously, in a white paper they released over a year ago they talked about the potential of these sensors, but ultimately, that doesn’t seem to have made it into the product:
“The Basis B1 band then gets data on climate, sweat level, how much motion was used to generate the perspiration, and how all of that relates to the body’s internal temperature. While the raw metrics aren’t seen by the user, this set of data provides a powerful set of parameters with which to model the body’s thermoregulatory behavior. On top of that, the Basis B1 band can determine the impact on the cardiovascular system via the optical processing engine—and this is something that no other device on the market today can do.”
So perhaps down the road we’ll see more maturity in this area, but right now these metrics are mostly in the gee-whiz category.
Sleep:
Unlike most fitness trackers on the market today, you don’t need to tell the Basis that you’re about to fall asleep. Most other units today require that you first let the unit know that you’re about to switch to sleeping, then it tracks sleep. But with the Basis B1, it’ll automatically pickup and recognize sleep – which is pretty cool.
The reason this is meaningful is that I often forget on other units to turn it back to ‘day/activity’ mode, which means that on those units it won’t then record the steps the next day. But with the Basis it tracks both sleeping, as well as steps (for example, going to the bathroom in the middle of the night).
Sleep isn’t displayed on the watch itself, but rather online after synchronization. You’ll first see it within the activity summary for the day within the Insight section:

This section is actually summarizing the sleep for that day. You’ll then see an entry for the sleep itself, noting the exact minute you fell asleep, as well as woke up:

I found the exact times surprisingly accurate. Including cases where I had taken a brief nap – such as waiting on takeoff on the airplane, like below on a different day:

For the sleep totals of the day, it’ll also give you a quality score. For example, you’ll see below where I managed way more sleep than normal, I got a much higher rating (95) versus earlier (61):
In the event of interruptions to sleep, it’ll note that as well.
Next to each ‘activity’ (including sleep) I can then dive into that activity in more detail. For example, here’s a longer sleep session where you can change and look at heart rate and other sensor metrics. You’ll see my average HR was 48 for the entire night, but it went as low as 38. Along the very bottom it also labels when I was asleep, awake, active, or unknown.
Now, it’s only within the sleep ‘activities’ that you’ll get Resting Heart Rate data, which is then displayed in the Insights tab. Resting Heart Rate (RHR) data is really useful in evaluating fatigue. While not perfect, once you track resting HR data long enough you can very easily start to look at trends and in my training I can easily pick out when I’m simply exhausted. By using that I can then explain other circumstances, such as slow paces for a given HR.

Calories:
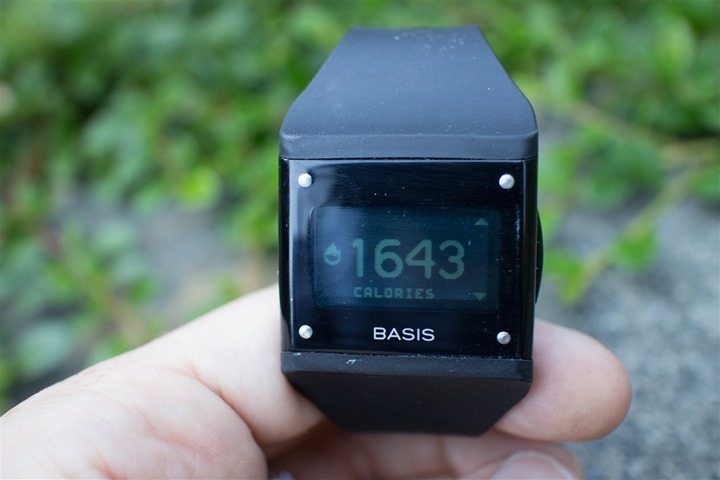
Finally, the Basis unit measures calories. It’ll display calorie burn information on the watch itself:
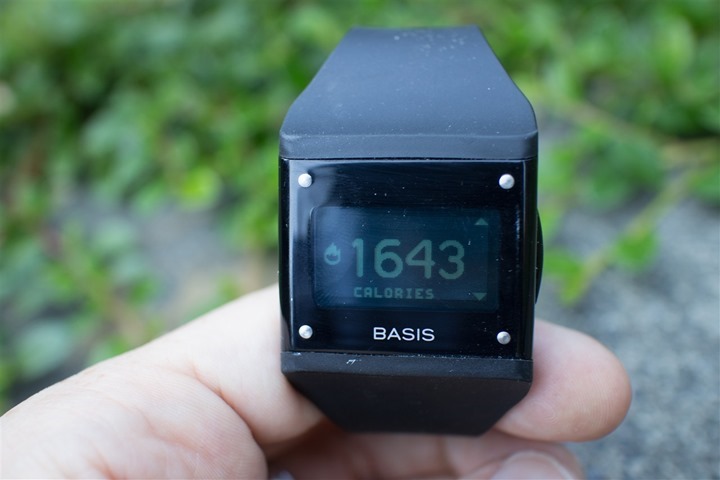
I went in search of exactly how and what it’s measuring, but that’s pretty slim. The only information Basis provides is this:
“The Basis band uses its various sensors to measure your heart rate, movement, and temperature and figures out how much energy you are using up at every moment.”
Well then, glad we covered that.
The calorie information is computed 24×7, and does appear to include your baseline calorie expenditures. For example, if I zoom to the middle of the night, I’ll see my calorie burn rate at 1.2 calories per minute. In other words, by time I wake up in the morning I’ll have burned enough calories to eat a candy bar. Or at least, that’s my story.
I went back and looked at a day where I had a run in the data. I was curious to see what the calorie burn was like there. Surprisingly, it tracked fairly well. Assuming a calorie burn rate of 14.2 calories per minute, that’s 852 calories/hour. Assuming a simple math estimate of 100/calories/mile, and since I’d likely average about 8 miles/hour, I’m roughly in the ballpark.
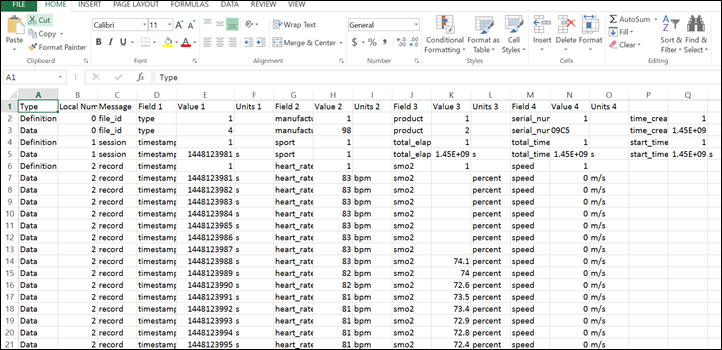
On the flip side, you can clearly see that the leading trigger for calorie burn isn’t heart rate or skin conditions, but rather steps. Take for example this indoor trainer ride. In this case, it was burning at about 2.5 calories/minute, or basically 150 calories an hour. Obviously, this is way too low for a hard hour-long trainer workout.

Finally, at the end of the day you’ll see the totals for calorie burn in the charts, allowing you to better track how that might correlate with other activities, such as steps:
Uploading Data via Computer:
You have three options for uploading data. I’ll cover each one separately. The first is via USB cable, the same USB cable that you use to charge your device.
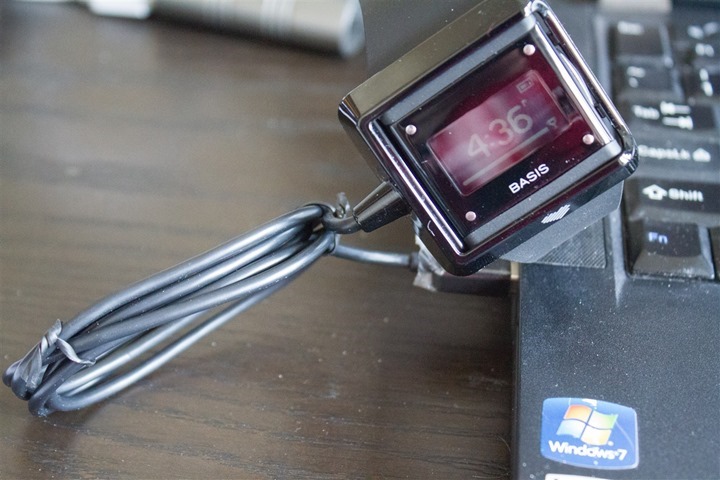
You’ll simply clip in the watch into the cable. Even after all these months I still find the clip portion a bit wonky. Sort of a minor puzzle each time to get it to pop-in. But, once it’s in, you’re good to charge/upload:
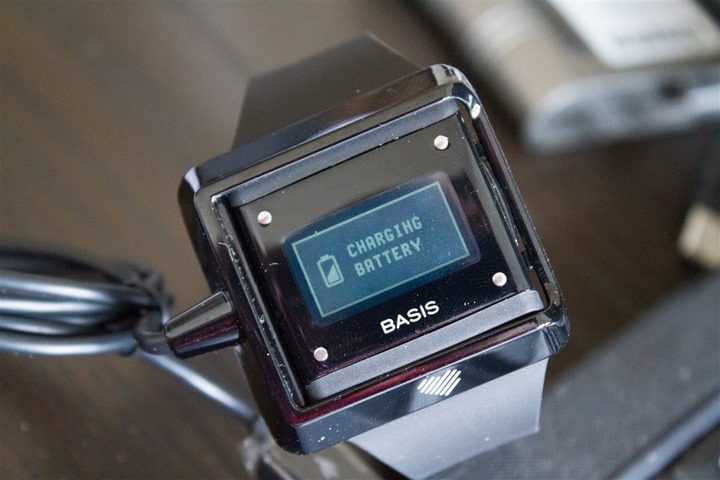
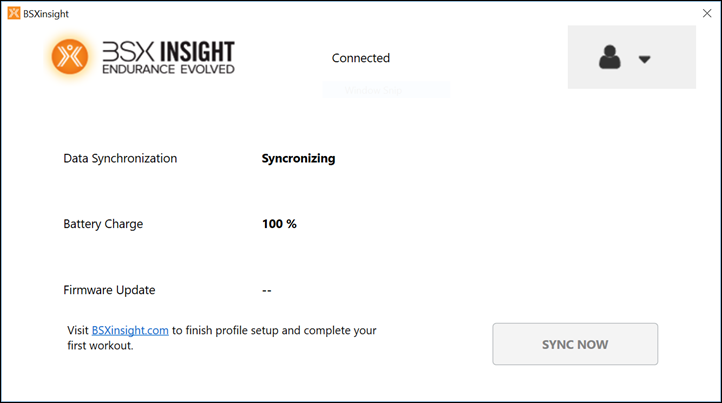
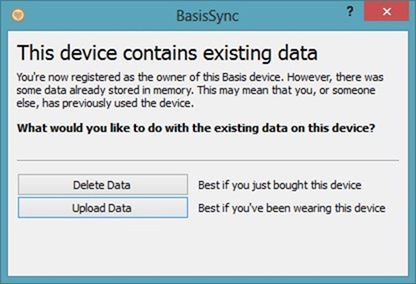
It’ll trigger the desktop software – called Basis Sync – to run the synchronization process. The desktop software itself requires having authenticated with your online Basis account. I’ve found this online authentication piece more forgetful than a 90-year old grandma. The frequency at which it seems to forget my credentials and require that I re-enter them astounds me. But once I remind it, it goes about its business – the business of uploading my data.
The uploading process only takes a few seconds to complete. The Basis Sync software doesn’t really contain any settings to change, though it does allow you to see some basic information about your device:

Any information that you need to change you’ll need to do on the Basis website. I do wish they’d follow their mobile apps lead and have a setting that automatically changed the time zone of the device to your computers local time zone, rather than having to go to the site each time.

Once the data is uploaded, you’ll see it online as I’ve shown throughout the review to date.
iOS (iPhone/iPad) App Overview:
Yesterday Basis released their iOS app for the iPhone 4s and above. The app is fairly bare-bones today and really only does one thing: Sync your data. Which to be fair, is all I really care about right now. And for that task, it does so quite well.
To trigger the sync process you’ll merely tap the right button on your watch after opening up the app on your iPhone. Then on the watch you’ll tap the button again to sync the data:
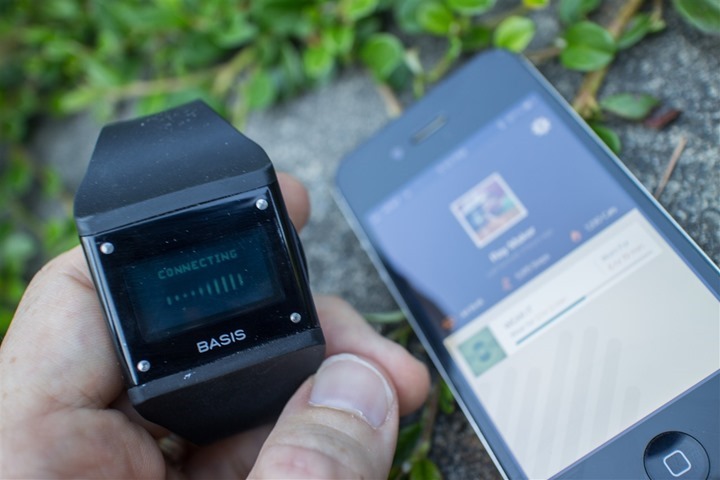
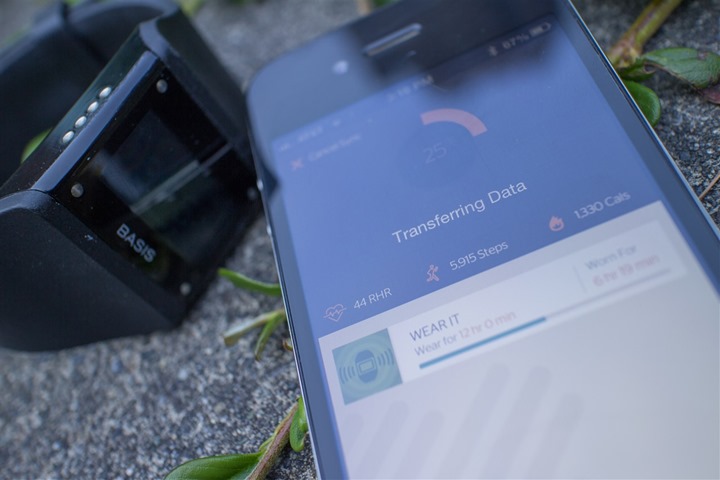
It takes perhaps 60-90 seconds to complete the process, including uploading the data:
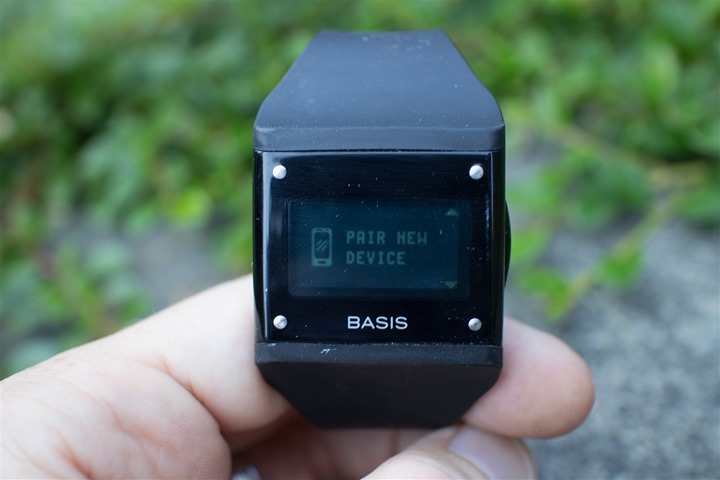
From the watch, you can also de-pair as well as re-pair. Interestingly (and kinda cool), you can pair it to multiple devices. In my case I paired it to both an Android phone as well as a iPhone.
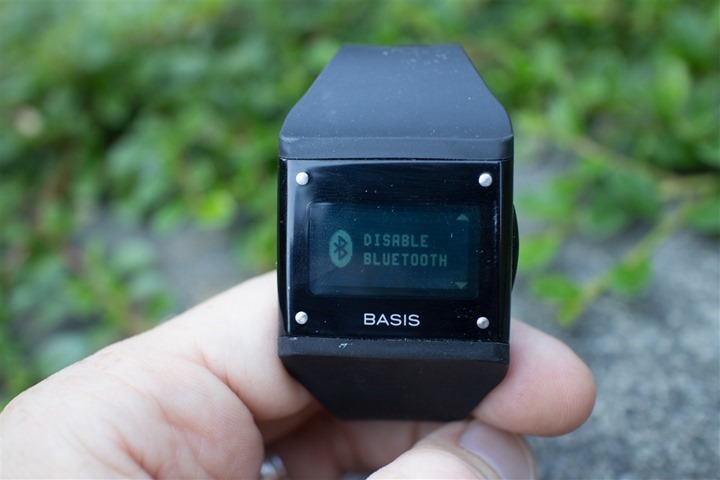
Finally, within the iOS app, the only other item today offered is top-line statistics about your steps and calories, as well as any habits. There’s simply not much there yet.
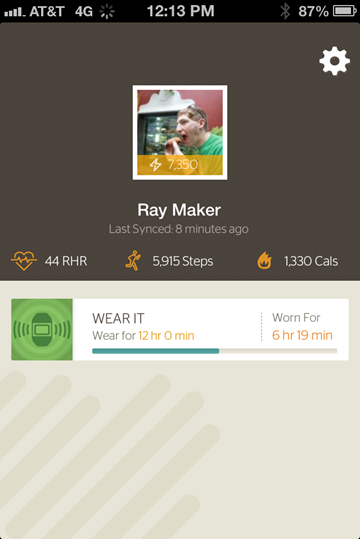
The Basis team released this ahead of their planned schedule, primarily in an effort to get the sync portion out the door, rather than waiting on everything. I’d definitely agree that was the best decision.
Android App Overview:
Until the recent release of the Basis Android app, the only way to synchronize the data was via a physical computer connection over USB (prior to the iPhone release yesterday). The app added the ability to instead synchronize your activity data via Bluetooth– as well as change the time zone information (key for frequent fliers like myself).
The challenge with Bluetooth,Basis, and Android though is significant – in short, it’s a mess. Support on different handsets is very minimal (and in fact, only a few phones are supported for the Basis app). So you can’t just use any Android phone. First, you’ve gotta have a phone they support (only a few models). Then you’ve gotta have the right version of the Android OS. That gets even worse because certain carriers restrict which OS versions you get to download.
Assuming you manage to hit all those requirements and successfully install the app – you’ll be here, ready to pair your new device.
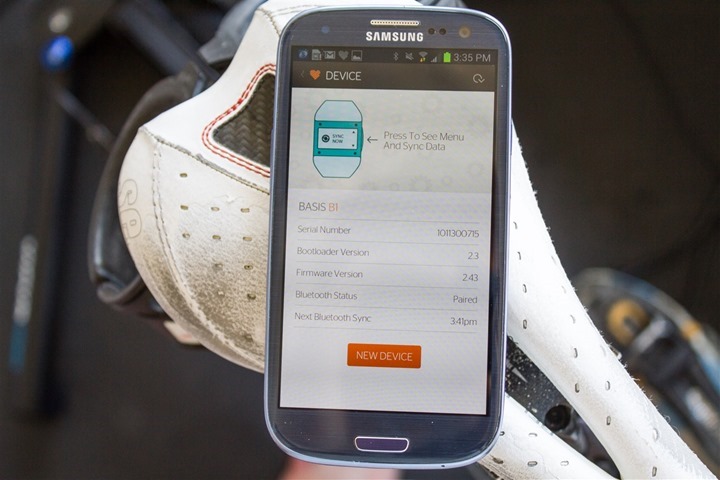
Pairing is also offered via that same right button, and then pressing either up or down. The pairing process only takes a second, and then just like on iOS, to trigger a sync you’ll simply tap the right button:
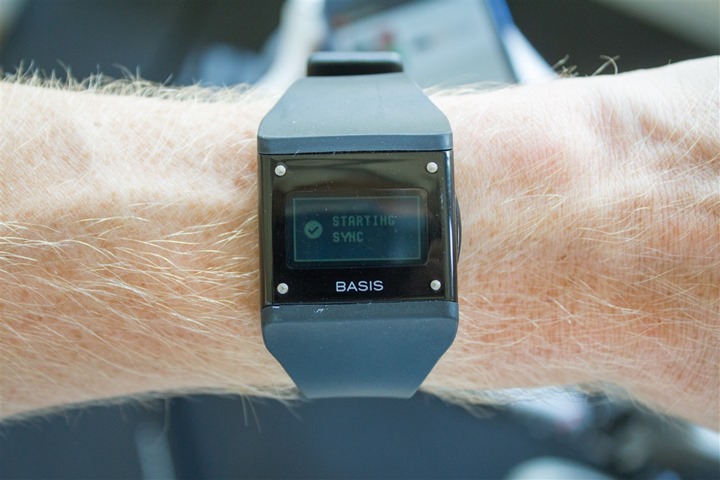
From there it’ll download the data.
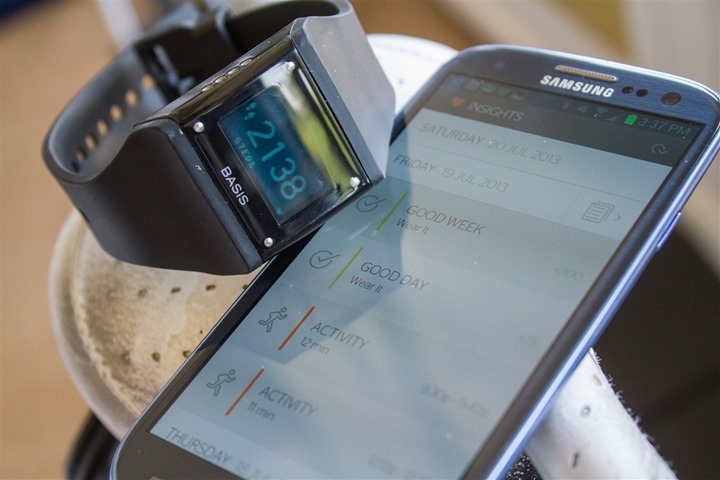
After the data is uploaded, the Android app does include a bit more information than the iOS app. The app gives you your Insights data, which is essentially the Facebook-feed-like timeline of your activity data:
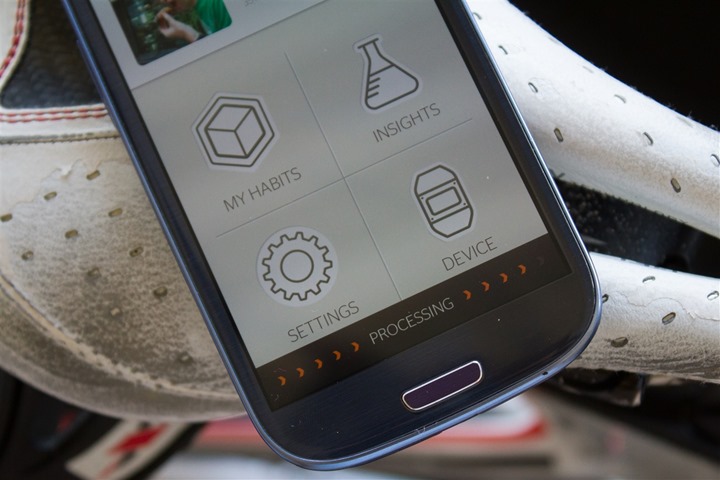
Additionally, it’ll give you status on any habits:
Best of all, both the Android and iOS apps will let you automatically sync your timezone settings to your phone’s time if you travel. Ideal for people like me!
It won’t however give you detailed data access. Ultimately, in order to really analyze any data, you’re going to need to head up to the website.
Website Analysis:
I’ve covered much of the website throughout this post, so it seems silly to re-hash it. But, perhaps instead to provide a most holistic context I’ll just briefly talk about the core areas of the site and how it works. This allows you then to understand a bit more on where all the screenshots came from.
On the Basis site you’ve basically got three main areas you’ll be looking at: Insights, Data, and Habits.
Starting with Insights, this gives you a bit of a Facebook timeline approach to your data. Significant events over the course of your day are bubbled up into status chunks. For example, sleep, segmented activities, or just general totals:

Within that you can click on any given Insight and have it take you to the data page with more detail on that particular moment. Sorta like double-clicking on something to expand more detail.
Next we have the Data section. The Data section is divided into two pieces, ‘Detail’ and ‘Patterns’. Detail is what you’ve seen the majority of within this review. It’s formatting is similar to HR graphs and pace metrics that you might find on a GPS watch post-workout, except applied to 24×7 monitoring. You can use the time slider at the top to zoom in or out on a given chunk of time, and then switch which metrics are on the graph.

Meanwhile, patterns takes this up a level and provides an hourly summarized color that’s then shown over a multi-week period. This allows you to clearly see patterns. For example, below you can easily start to identify patterns within my day to day schedule:

Above you can see my HR patterns for a two week period. You’ll see my HR is lowest during the day, and highest mid-day, particularly in the early evening when I’d exercise. In most of these cases I was wearing it during runs/bikes those weeks, hence the higher data points.
You can switch to different metrics (Calories, Heart Rate, Skin Temp, Perspiration, Steps), and see how things impact one another. For example, more steps tends to equal higher HR.
Perhaps the most interesting observation is that my skin temperature is actually warmest at night. I suspect though this has to do with simply being under the blankets while sleeping, more than it has to do with my actual skin temperature.

The challenge with the patterns piece and me personally is my travel schedule. The unit doesn’t actually correctly apply the time zone information, but instead just leaves everything as-is. This means that when I look at it right now, everything is showing like I slept in the middle of the day, because while I’m on the US West Coast today, I’ve otherwise been in Europe the previous two weeks:
Above you’ll see the gray boxes are where I wasn’t wearing the unit. Sometimes I sleep with it, sometimes not.
That said, aside from time-zone wonkiness, patterns is probably the best way to start making statements about your day to day activity levels and…well..patterns.
Lastly we’ve got Habits. Habits is probably the area I used least, simply because I found it least interesting. Though, I could see how others might find it valuable. The idea behind Habits is to measure a repeatable task. Out of the box it includes the ‘Wear It’ habit, which is designed at getting you to wear the watch daily. Each time you wear the device, it validates that Habit for the day.
The site then allows you to create your own habits within one of three categories: Activity, Sleep, or ‘Doing’. Except, it’s not so much creating your own as it is using pre-defined templates. And, in the case of ‘Doing’, there’s only one (the Wear It one above). So it’s really ‘Activity’ and ‘Sleep’ only. And sleep only has two options. Leaving us with Activity. You can see that the ideas are sorta basic, basically just aimed at having you get up and move around.
This is an area where I think they could do a bit more and be more creative in what the activities are, as well as expand a bit. It all seems very placeholder to me, rather than finished. Which ultimately, is why I found it fairly un-interesting.
Speaking of things that don’t really seem clear, we’ve got the Points and Levels system. The platform displays points throughout the site and apps, but there’s very little information about what to do with these points. There’s some basic information stashed away in a support page about how they accumulate, but ultimately, I just don’t get it. For example, is 7,550 points a good number or a bad number? What do I do with these points?
Then there’s the ‘Levels’. There’s absolutely zero information on the site for levels. There’s this single mention of it (again, in support), but quite frankly, that makes no sense given the context. Given the company’s past discussions of gamification, I feel like both Levels and Points are an attempt at checking off a checkbox on some venture capitalist scorecard that says “Do you have health gamificiation?” – but beyond that, they have no value.
Updating Firmware:
The B1 supports updating the firmware to add new features or fix existing bugs. For example, in order to access the recently added Android Sync capability, the firmware had to be updated.
When a new firmware update is detected, the Basis Sync software will prompt you that it needs to update the unit. It’ll first synchronize any existing activity data that hasn’t yet been uploaded, then it’ll go ahead and begin the update.
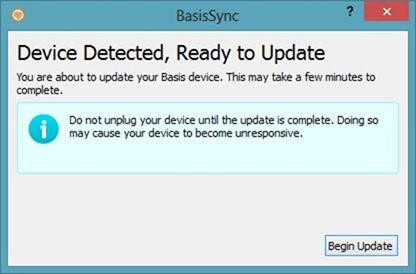
The entire process only takes a minute or two before it completes.
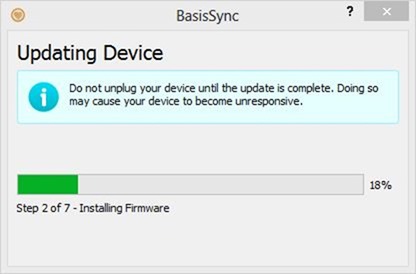
Once the update is complete, you’ll be back in business. After updating, you don’t need to modify any settings on the unit itself (in part, because there aren’t any settings to modify in the unit), as the Basis Sync software will re-synchronize all of your settings back to the watch (such as time zone information).
Battery:
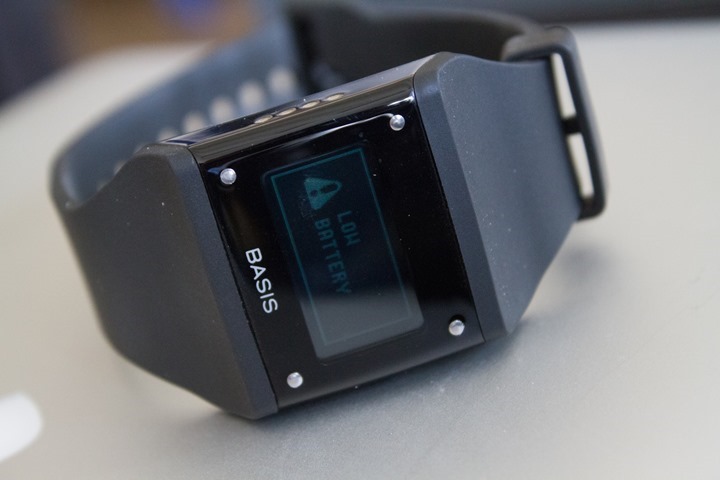
Just a super-brief mention. I got pretty consistently 6 days of battery life between charges. However, now with Bluetooth enabled, I seem to be getting a bit less in recent weeks, perhaps about 4.5 days.
The unit will display a low-battery warning when it’s got about 4-8 hours left (it seems to vary a bit), before it goes kaput entirely.
Bugs and Miscellaneous:

In recent reviews I’ve been adding a bug section to cover things that I stumbled upon. Because I’ve had the watch for 3+ months now, I’m really only focusing on recent bugs that I’ve seen. In the case of the Basis watch, the issues I’ve seen are largely in the ‘annoyance’ category, rather than the show-stopper category. Remember a ‘bug’ is different than ‘by design’. For example, the lack of a feature is something I highlight within a given section is considered ‘by design’, whereas something not really working right is below.
– I’d see occasional issues with the Basis Sync software forgetting credentials. While not a huge deal, it’s been annoying.
– Once while the watch went unused a few weeks I saw an issue where the watch seemed to forget who it was. When I plugged it into the computer, the software was smart enough to recognize the condition, but at the same time I wouldn’t have expected it to lose simple pairing information just due to non-use for a few weeks (for example, if you went on vacation and forgot it).
– The band itself can be wonky. I’ve had it ‘break apart’, sending the watch plummeting to the ground. One time hitting concrete, another time tile kitchen flooring. Neither case broke the unit, and it’s only happened 2-3 times over the last 4 months, but still, one wrong landing and it could be done for.
– I had water issues in the first unit I received. This required me to have it swapped out from Basis. I didn’t wear it in the pool, but did take one or two showers before it occurred (which on their site they say is fine).
Pros and Cons:
As always, the review attempts to cover many of the more nuanced pros and cons of the device, but this brief section boils down the big ticket items:
Pros:
– Awesome for determining day to day patterns
– Great for gathering resting heart rate data
– No HR strap required
– Bluetooth Sync to both iOS and some Android phones
– Step counter can be reasonably accurate
Cons:
– Watch band can temporarily fall apart
– Waterproofing is potentially suspect
– Heart rate data won’t work while working out
– Questionable value of some data metrics (skin temperature, perspiration)
Comparison Tables:
In order to assist you in comparing features, below is a comparison table of the Basis B1 unit against others fitness trackers. Note that you can both expand the chart, as well as create your own comparison chart against other models that I’ve reviewed here. As is always the case, I only include models in the comparison table that I’ve personally tested and/or reviewed.
Copyright DC Rainmaker – Updated May 29th, 2017 @ 9:08 amNew Window
Price$199 (now discontinued)$139$129$79$149
Body PlacementWristWristWristWristWrist
Data Transfer TypeUSB & Bluetooth 2.1Bluetooth Smart, USBBluetooth Smart/USBBluetooth Smart/ANT+Bluetooth Smart
Bluetooth to PhoneYesYesYesYesYes
Has GPS built-inNoNoNoNoNo (can use phone’s GPS though)
WaterproofingShower, no swimming50mIPX7 (1 meter for 30 minutes)50 MetersSplash only
Battery Life4-6 daysUp to 5 daysUp to 5 days1 YearUp to 5 days
Battery TypeUSB RechargeableUSB RechargeableUSB RechargeableCR1632USB Rechargeable
Changeable Bands/StrapsNoNoYesYes
Phone Music ControlYesYesNoNo
Displays timeYesYesYesYEsYes
Has time alarmsNoYEsYEsYesYes
Has smart sleep alarmsNoNoNoNo
Smartphone NotificationsNoYesYesChoresYes (Text/Phone/Calendar only)
Workout guidance/coachingNoNoNoNoInterval workouts
Step CounterYesYesYesYesYes
Stairs ClimbedNoYEsNoNoYEs
Distance WalkedNoYesYesYesYEs
Calories BurnedYesYesYesYEsYEs
Sleep MetricsYesYesYesYesYes
24×7 HR MetricsYesYesNoYes
Skin TemperatureYesNoNoNoNo
Heart RateYesyesYesNoYes
Optical Heart RateYesYesNoYes
Can re-broadcast Heart Rate dataNoYesNoNoNo
Skin PerspirationYesNoNoNoNo
Cycling SensorsNoNoNoNoNo
Action Camera ControlNoYesNoNoNo
Web ApplicationYesYesYesYesYes
PC ApplicationYesYEsYesYesYes
Mac ApplicationYesYEsYesYesYes
Phone AppsAndroid/iOSiOS/Android/Windows PhoneiOS/AndroidiOS/Android/Windows PhoneiOS/Android/Windows Phone
Ability to export/sync settings from computer/phoneYesYesN/AN/AYes
3rd parties can access data via APINoYesNoYesYEs
Ability to export your data out of platformNoYesYesYesYEs
Amazon LinkLinkLinkLinkLinkLink
Clever Training – Save a bunch with Clever Training VIP programN/ALinkLinkLinkLink
Review LinkLinkLinkLinkLink
The products are dynamically generated, so it’s really best to expand out the chart to see all results and/or customize your own.
Summary:
The fitness activity tracker segment is massive – both in potential, as well as how many new entrants are entering the fray each month. Companies like Nike, Fitbit, BodyMedia, and now Withings are amongst the biggest – and also most established. But all of those companies are focused on what I believe to be a slightly different consumer than that of the Basis watch. With the B1’s price being about twice that of most of the others in the market, it has to bring more to the table. And in that case, it does it. It brings optical heart rate recognition and 24×7 monitoring of heart rate, skin temperature as well as movement (steps).
The question is – is that added price worth it? That’s a bit of a tough question. If you’re looking for heart rate monitoring during sports activity, you’ll be disappointed. It simply doesn’t work there. Basis notes that the unit is for the other 23 hours of the day you’re not working out. And I’d definitely agree with that. Don’t get this unit for workout data, it’s just not useful. But when looking at HR data for those other 23 hours, its rather illuminating in what the unit will surface about your day to day patterns.
So outside of sports, it generally does the job well during that other 23 hours. As you saw in my step-counter comparisons, there was definitely reliance on one arm over the other for more accurate results. I found that in day to day activity the optical heart rate did well (albeit slightly laggy). But if you’re monitoring over the course of a day, a bit of lag is perfectly fine from macro standpoint.
Lastly, there’s data such as skin temperature and perspiration. While these might be interesting sports science geek data points, there’s no clarity on what to do with these metrics today from Basis. I could have labeled them “Pineapple smoothies wanted per day” and that would have been more valuable to me as a consumer. And I suspect, most consumers will fall in the same camp.
Ultimately the Basis is a pretty fascinating first product for the company. There’s a lot of really cool things, especially around 24×7 HR monitoring that work and shine really well. And then there’s a number of areas that just need more polish and explanation. Hopefully in time that polish will be applied.
With that, thanks for reading – and as always, feel free to drop a note below and I’d be happy to try and get questions answered as best as possible.


